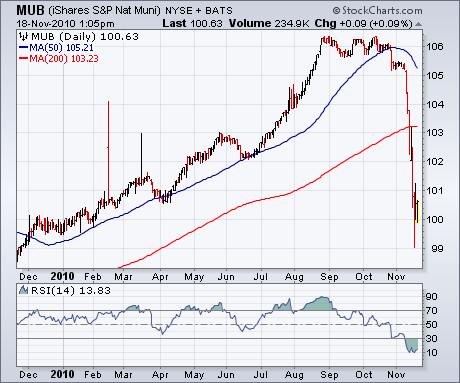
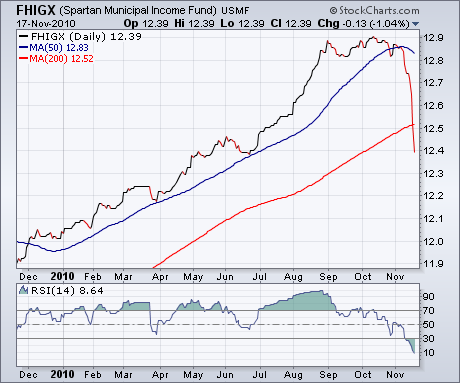
We've been showing the upward trend in bond yields since the Fed's latest QE2 package was announced last week. We've also shown the drop in bond prices, especially Treasury bonds and notes. The bond category that's been hit the hardest has been tax-exempt municipal bonds. The first two charts show just how bad they've been hit. Chart 1 shows the S&P National Municipal Bond ETF (MUB) tumbling to a new 2010 low over the last month. It has also broken its 200-day moving average for the first time in two years. Mutual fund bond investors haven't escaped the price plunge. Chart 2 shows the Fidelity Municipal Income Fund (FHIGX) breaking its 200-day line as well (other muni bond funds look pretty much the same). The only bright spot lies in the deeply oversold conditions of both funds. That suggests that the muni bond market may be due for a bounce. But there's a bigger message (and warning) involved in the two charts. A lot of investors have poured money into the fixed income market over the last year in a search for yield (at the expense of stocks). Part of the preference for fixed income has also been a desire for safety. While it's true that bonds are generally safer than stocks, it is possible to lose money in bonds. When bond yields rise, prices fall. If you have money in a bond mutual fund, it will lose money when long-term rates are rising (as they're doing now). Yes, you'll get a higher yield. But the benefits of a higher yield will be more than offset by falling prices. Your mutual fund statement is based on price, not yield. The sharp drop in the Fidelity muni bond fund in Chart 2 shows that bond funds aren't always safe.


