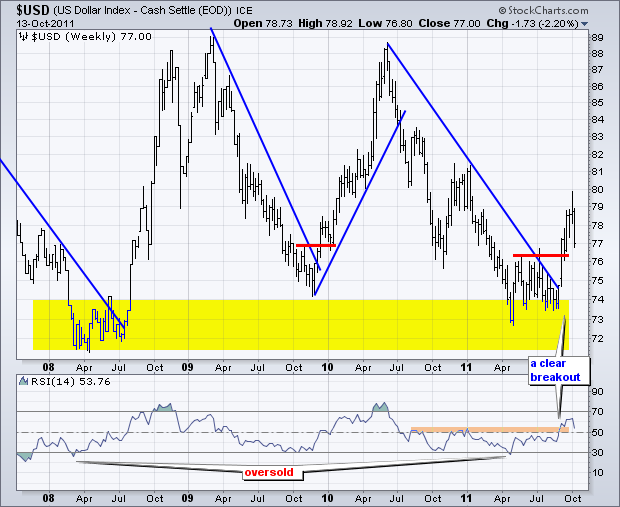
The US Dollar Index ($USD) was hit hard this week with a 2.2% decline. Weakness in the Dollar buoyed oil and stocks, which have been negatively correlated with the greenback. Dollar weakness and Euro strength is also associated with the risk-on trade. Despite this week's decline, the bigger trend is still up and support is close at hand. The first chart shows weekly prices with a Double Bottom breakout in September $USD broke resistance with a strong surge that was confirmed by RSI, which broke to its highest level in a year.
Click this image for a live chart.
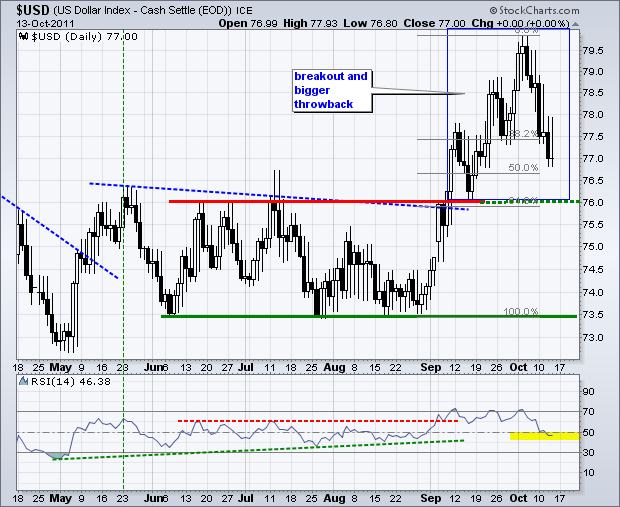
The second chart shows more details with a daily candlestick chart. There are three reasons to expect support soon. First, broken resistance in the 76 area turns into support. A "throwback" to broken resistance is not uncommon after a breakout. Second, a move to the 76 area would retrace 61.80% of the prior advance. Third, RSI moved into the 40-50 zone. This area acts as support during and uptrend.
Click this image for a live chart.


