Hello Fellow ChartWatchers!
Having the right subscription level can save you a significant amount of money OR depending on how you use it, it can cost you a lot of money in the form of bad trades. At StockCharts, we offer several different membership levels - Free, Basic, Extra, ExtraRT and PRO. I want to make sure everyone knows the difference between those levels.
Our ExtraRT and PRO services provide you with charts based on complete, realtime data from the NYSE, NASDAQ and TSX exchanges. Unfortunately, those plans are also our most expensive - partly because those exchanges force us to tack on a monthly surcharge for that realtime data.
Our other three plans also provide realtime data (for most US stocks, sorry Canada) without the need for that additional surcharge. How is that possible?
It's possible because the realtime data on those charts comes from the BATS exchange. BATS (which stands for "Better Alternate Trading System") is a growing electronic exchange based in Kansas City that provides all of its trading data for free(!)
So what's the catch? Well, there are a couple:
- As I mentioned, BATS data is only available for US stocks
- Volume data from the BATS exchange is significantly less that the volume data from the NYSE/Nasdaq
- Price data for thinly traded stocks can be different from the price data from the NYSE/Nasdaq
- Not all thinly traded stocks are covered by BATS
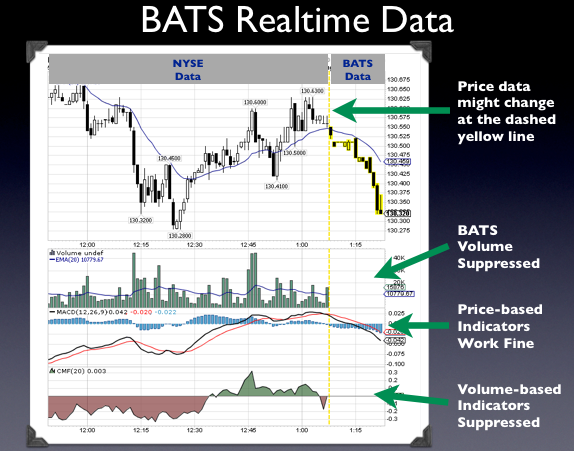
Because the volume data is different, we only use BATS data to fill in the most recent 20 minutes on our charts. After that 20 minute delay, we replace the BATS price-only bars with the price+volume bars from the NYSE/Nasdaq. You can see that process on the following slide:
This slide shows a 1-minute price chart that a typical Basic or Extra member would see. It shows how we highlight the BATS price-only bars in yellow (because they are subject to change) and how we suppress the BATS volume data as well as volume-based indicators. None of those restrictions happen for ExtraRT members.
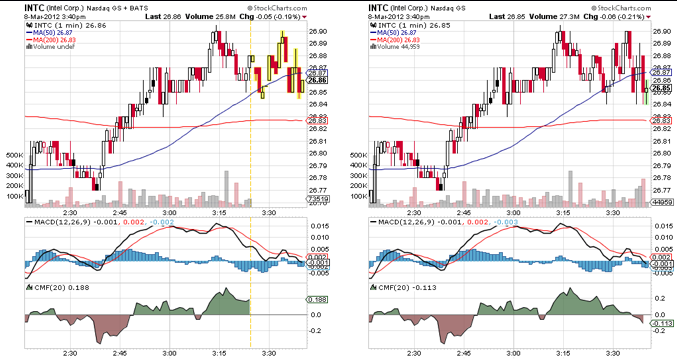
Below I have two more slides that show how BATS data and NYSE/Nasdaq data differ. The next slide shows the differences for a fairly liquid stock (INTC). The BATS version is on the left and the NYSE/Nasdaq version is on the right.
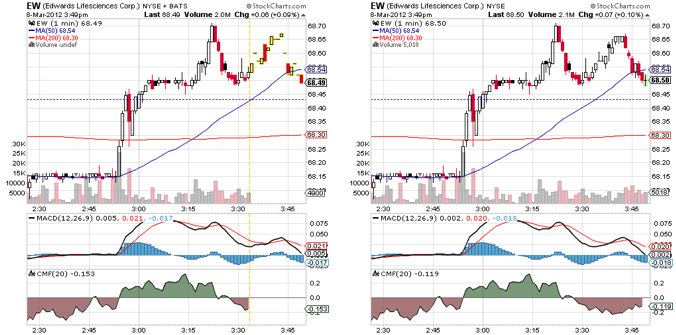
And here's a similar slide for a more thinly traded stock (EW):
If you look carefully, you'll see that the price bars for INTC match pretty closely (but not exactly!) and that the price bars for EW have lots of differences.
If those price differences are important to your analysis or if you don't like the 20-minute delay on the volume data (or if you need realtime Canadian data) then you'll want to use either our ExtraRT or PRO service. Otherwise our less expensive Extra service should work well for you.
(Members can use the "Your Account" link at the top left corner of any page on the site to change their service level. Non-members can learn more about our different plans by clicking here.)
- Chip


