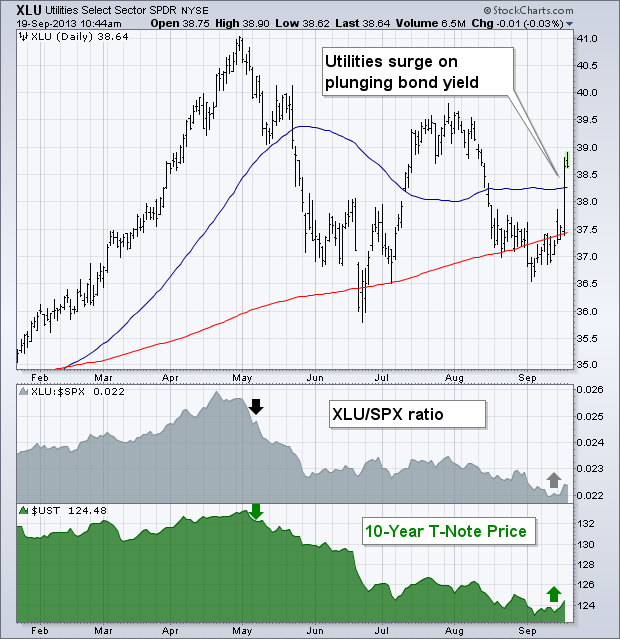
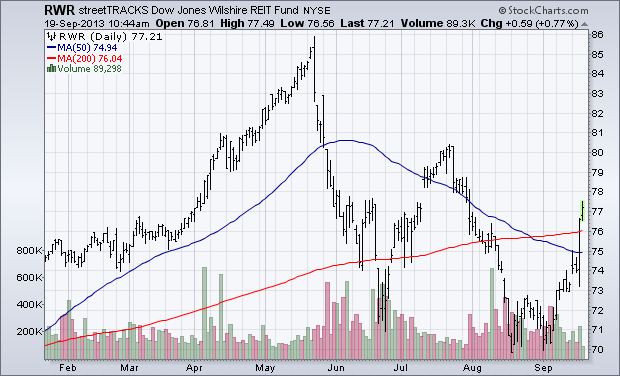
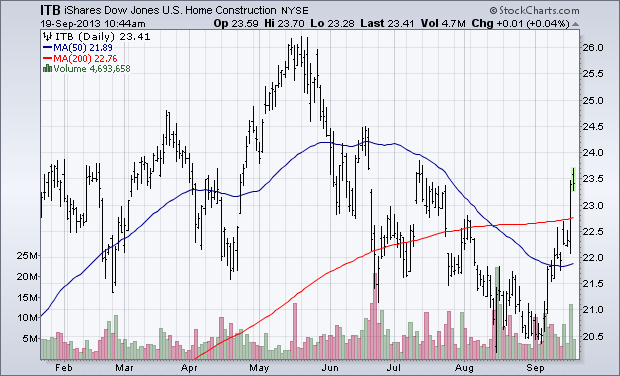
The Fed surprised everyone yesterday by deciding not to start its widely anticipated tapering of bond purchases. Although that decision was a surprise, market reactions weren't. In fact, each market did pretty much was one would expect. Bond yields tumbled and bond prices soared. Stocks surged around the world. The dollar plunged along with bond yields which pushed gold and other commodities higher. Foreign stocks surged, especially in emerging markets, which had been hit especially hard by rising U.S. bond yields and a stronger dollar (more on that later). Within market sectors, yesterday's biggest gainers were rate-senitive stock groups that had been weakened by rising bond yields since May -- including homebuilders, REITS, and utilities. Chart 1 shows the Utilities Sector SPDR (XLU) surging nearly 3% yesterday to end back above both moving average lines. The gray areas shows the XLU/SPX ratio falling since the start of May. That's when bond yields started to surge and bond prices collapsed (green line). Yesterday's collapse in bond yields, and bond price rally, turned those trends around. Chart 2 shows the Dow Jones REIT Fund (RWR) surging 3.5% on rising volume. Chart 3 shows the Dow Jones U.S. Home Construction iShares (ITB) jumping nearly 5% on rising volume.


