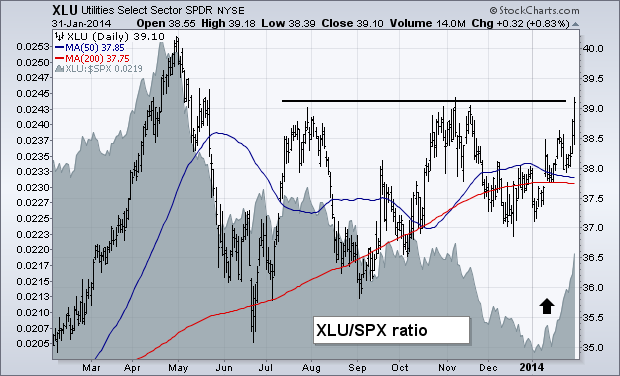
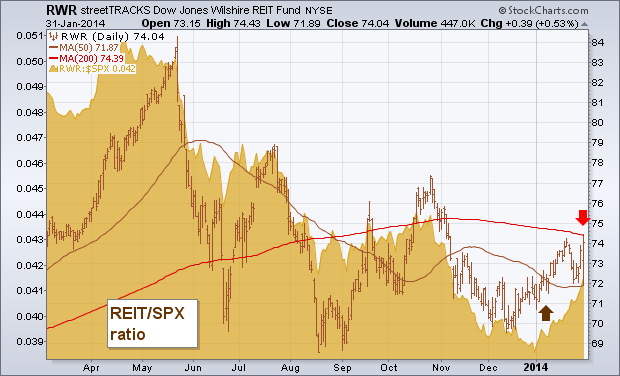
An early January message (January 11) talked about the need to do some rotating out of over-extended stock market groups that did especially well during 2013 into more defensive (and dividend-paying) groups that had been market laggards. The two I mentioned were utilities and REITs. I mentioned those two groups for two reasons. One was that they are defensive in nature, and usually hold up better when stocks weaken. The other is because both groups are closely tied to the direction of bond prices. With bond prices rising throughout the month (as stocks fell), those two groups have done especially well. Chart 1 shows the Utilities Sector SPDR (XLU) moving up to challenge its November high. Its relative strength ratio (gray area) has surged as well. [Dividend-paying stocks also do better when bond yields decline, as they did during January]. Chart 2 shows the Dow Jones Wilshire REIT ETF (RWR) also climbing during the month. Its relative strength line has risen as well. The RWR is nearing a test of its 200-day moving average. Homebuilders also had a strong week and a strong January.


