The Consumer Discretionary Sector SPDR (XLY) is a very important barometer in the US investing landscape. It sits on the edge of a breakout to new highs. July / August is typically the time frame that investors start to rotate into the discretionary stocks to position for the back to school stock up event and the massive Christmas shopping season. With the midst of earnings season upon us, option expiry yesterday and a few of the long trends showing weakness, it is an important time for the cyclicals to show strength. First of all a real quick check of the month long term chart to discuss the July/August acceleration in cyclical (discretionary) stocks.
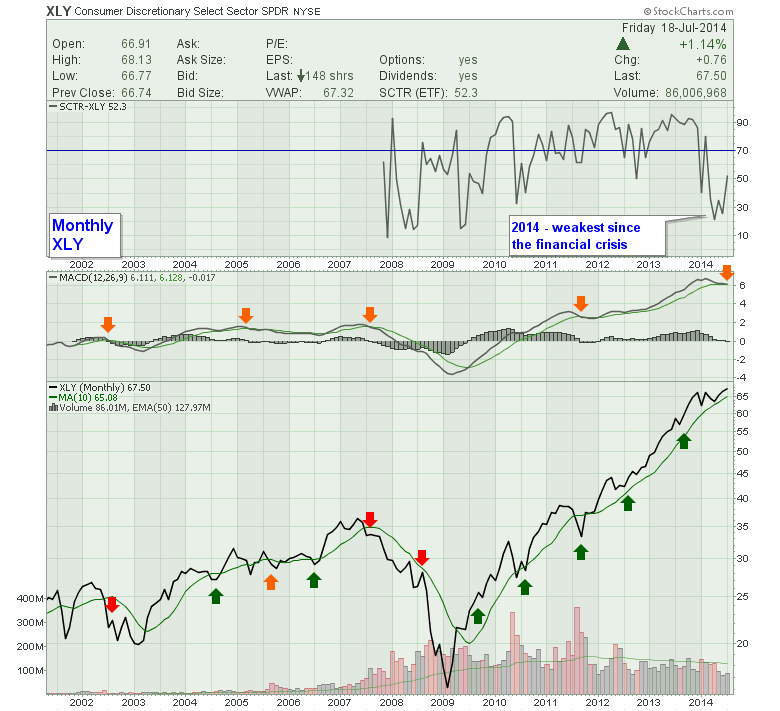
So in hindsight, July is a nice place to look for seasonal timing. It may drift into August for a low. You can see clear underperformance by the consumer cyclical sector in market years that were either down years or sideways. Notice even in 2007, the sector made the highs in May even though the S&P 500 ($SPX) made highs in October 2007. 2002 continued to be weak. In 2005, the $SPX was moving higher in the back 1/2 of the year (not shown), but not consumer discretionary. We want to see the cyclicals close higher at the end of August to confirm the sector strength into the strong period to December. In the Top plot, the SCTR ranking made lows not seen since the financial crisis. This is why I have some hypersensitivity to the sector now. The MACD has also approached its signal line to illustrate a zone of caution. Currently it resides below the signal. You can see the negative number in the MACD legend. One remarkable trend is the volume. While the $SPX is back to 2006-2007 levels, we can see this sector has a huge volume profile that is substantially larger than the 2006 period. Onto the weekly.
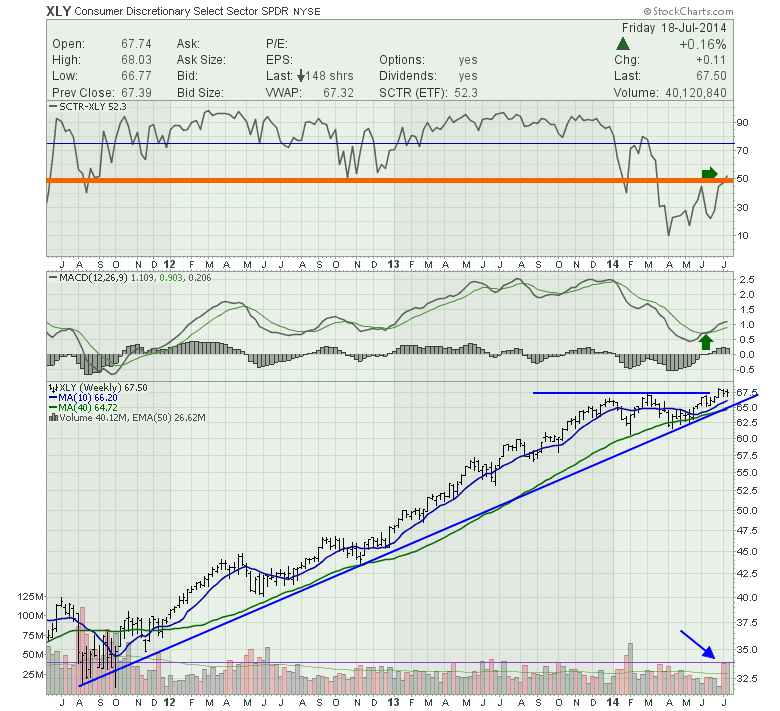
We can see the SCTR is just back to the 50% level. Will this form some sort of resistance where the sector becomes stuck at or under the average ETF? This is important as it has been hugely bullish since the Fed stimulus of 2012. The MACD has started to rally. If it was to fail here, it would be huge negative divergence, so we want to watch based on the clues of the SCTR. The recent volume has been huge and marks the 2nd largest back to back weeks all the way back to 2012. We can see the price action is near new highs and has paused here for three weeks after making new highs. As the price action is relatively close to the blue up trend line, all technicians would respect a break of a major 2 year trend line. Ok, next is short term daily.
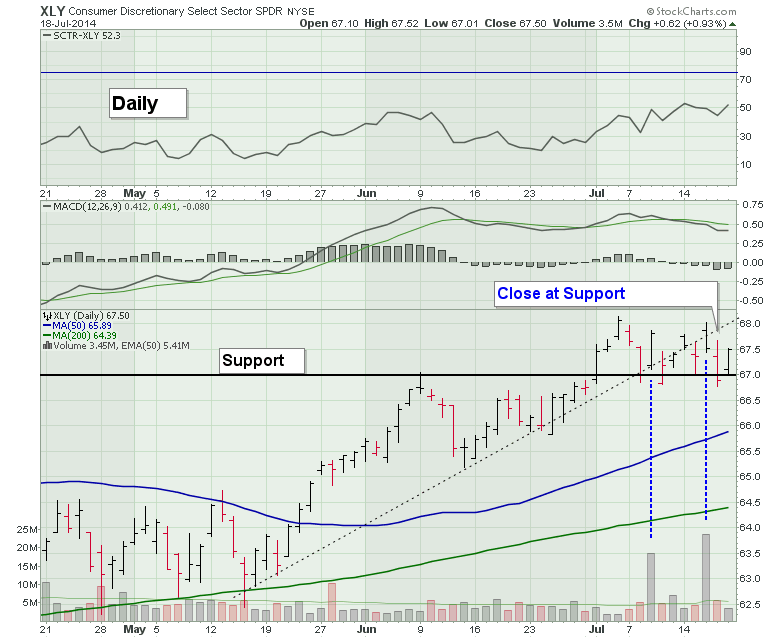
On the Daily we can see the weak SCTR. The MACD is sideways to down but nice and high. Price action is interesting on the 3 month view. Two huge high volume days are responsible for the big readings on the weekly. The first was a bounce off 1 month support. The second was a gap up and it fell all day but still closed higher than the previous day. Thursday marked a close at or below support depending where you place the line. The micro black dotted uptrend line was broken and we seem to be having trouble getting back above. It is still a bullish chart, but the long term and intermediate term (charts 1 and 2) suggest focusing on cyclicals for larger time frame direction.
Good trading,
Greg Schnell, CMT


