If ever the bulls needed to see some stellar earnings results and/or positive forward guidance, it was about one month ago. From the late September high of 2019 to the mid-October low of 1821, the S&P 500 fell nearly 10% just as earnings season kicked off. During the height of earnings season over the past four weeks, the stock market reversed and completely erased all of those pre-earnings season losses and even managed to tack on another 1% or so.
So what areas of the market triggered this bullish reversal? Well, let me first tell you the two sectors that did not - energy and materials. The XLE (ETF that tracks energy stocks) remains 10% below where it was in mid-September while the XLB (ETF that tracks basic materials stocks) is approximately 3% lower. Clearly there's been underperformance in these two sectors. But there is the potential of good news for both in the near-term. On the following chart, you'll see that much of the weakness in both sectors can be attributed to a soaring U.S. Dollar index ($USD). Both energy and materials tend to move opposite the U.S. dollar, especially key metals like gold (GLD). Take a look at the obvious impact of the recently rising dollar:
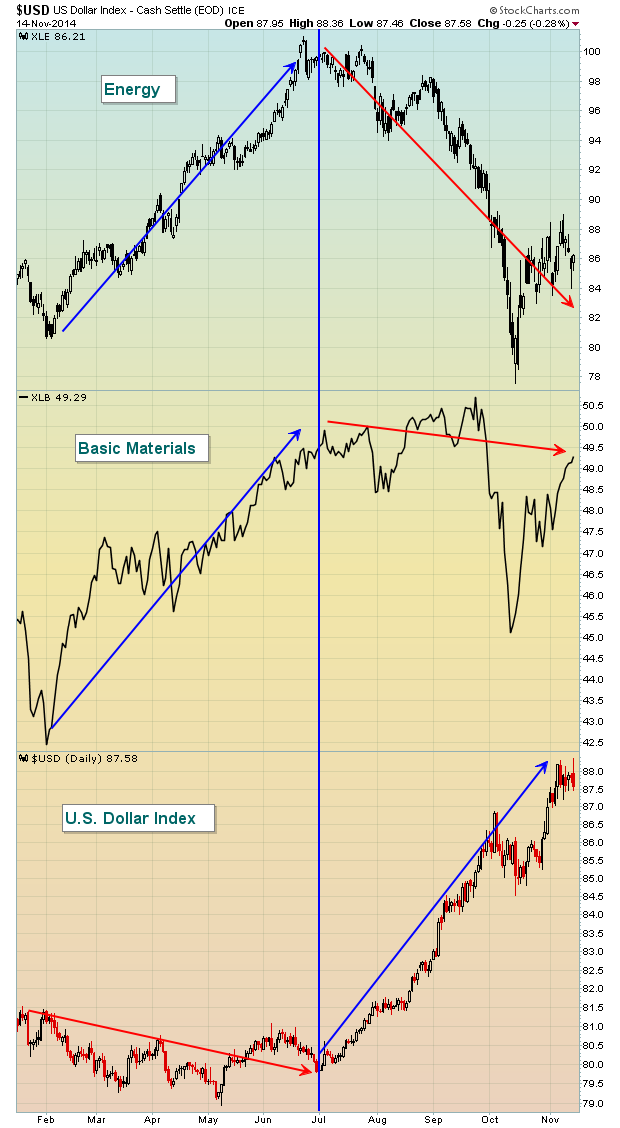
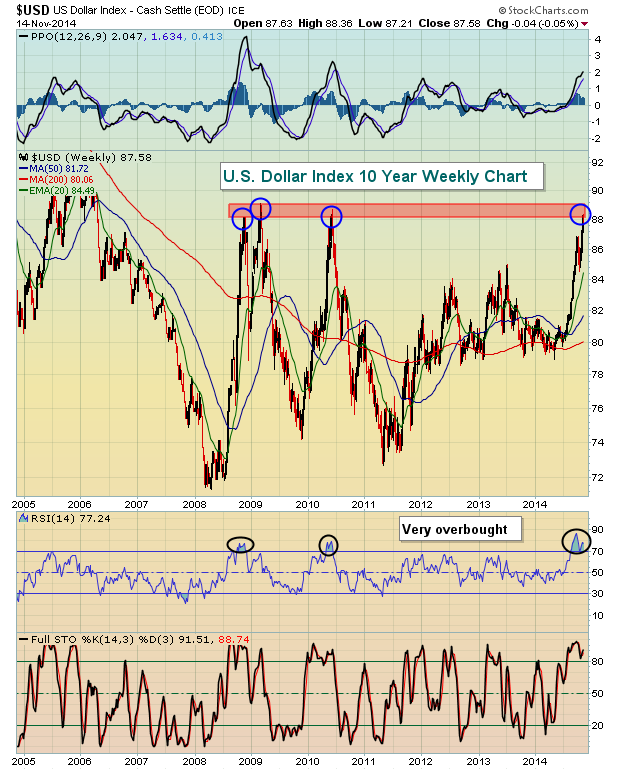
Both energy and materials have shown some strength off their recent lows and it could be in anticipation of a reversal in the U.S Dollar index ($USD) to the downside. On a long-term chart, that would make sense as the U.S. Dollar challenges multi-year price resistance. Take a look:
That's a quick look at the dollar and the possible implications it might have on energy and materials stocks. But let's get back to earnings. Since we've now ruled out both energy and materials as recent sector leaders of the market's rally, where did the strength come from?
Well, over the past month, industrials have posted a 12.10% gain with technology not too far behind with a 10.40% gain. The strongest industry groups have been transportation stocks ($TRAN), but that makes perfect sense given the drastically reduced crude oil prices. If the dollar falls, we'll likely see at least a temporary advance in crude oil prices which would have a negative impact on transportation. Therefore, let's skip that area of the market for now and focus on other strong components for potential short-term opportunities. Defense ($DJUSDN) is one area of industrials that looks very promising as it recently broke out to fresh new highs, supporting the overall market advance. Check out the strength below:
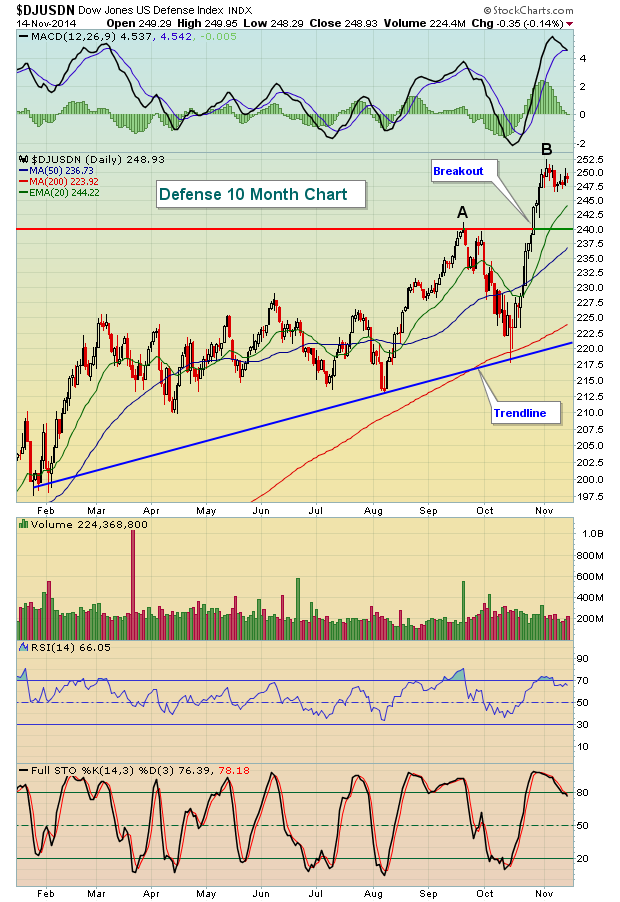
If you look at the September high (point A) and the recent high (point B), you'll see that the DJUSDN cleared its prior high by 4-5%, much more than the overall S&P 500. This is a sign to me that defense stocks are being accumulated and represent an area of the market that we should be interested in and monitoring for solid reward to risk entry points. In fact, one stock within the DJUSDN just posted earnings that topped Wall Street consensus estimates by 40%, possesses one of the best technical charts around and is literally residing at a key price resistance level - a level if broken would represent a 10 year closing high.
I'm featuring this defense stock as my Chart of the Day for Monday, November 17, 2014. Best of all, my Charts of the Day are now completely FREE as is a webinar this Wednesday evening that discusses the methodology behind EarningsBeats.com. During this session, I'll unveil my strategy of building a StockCharts Watch List of over 200 companies with better-than-expected bottom line results and superior technical strength. Simply CLICK HERE to register!
Have a great weekend and happy trading!
Tom Bowley
Chief Equity Strategist
EarningsBeats.com
