There is a relatively new song "Its all about the base" that jingles in my head every time I see these big broad trading ranges set up. Ebay is destined to be a classic technical analysis story when it breaks out from this consolidation. FireEye (FEYE) just broke out of one for a recent example.
On September 30th, 2014, Ebay Inc. (EBAY) announced that they were going to split out Paypal into a separate company under a new IPO. I couldn't find a date for the IPO, but the stock has been waiting for something. The only thing that paces back and forth more is a momma bear looking for her cubs. In a world of buy and sell, Ebay's stock couldn't be more trying. Indicative of an auctioneer running up the price only to slam the gavel and announce sold, this stock is clearly in that rhythm. As a short term trader, you need to trade this on the location of the stock price relative to the channel. Buy on the lows, sell near the highs. Buy on the lows, sell near the highs. Buy on the lows, sell near the highs.
What makes Ebay worth talking about now? The Paypal IPO. While the stock has gone relatively quiet in terms of volume, the price action recently couldn't be cleaner. The 'zoom' panel shows exactly that, straight up for 15 days in a row. So is this imminent? I think once the announcement of the date is set, it will probably be more difficult to find an attractive entry for the stock. This might be one of those stocks that needs a well thought out plan to be profitable because the entry will be key to profit. If you buy it near the highs, you risk the entire size of the channel. If you buy it near the lows, the stock is giving off nice clues that there is plenty of support. However, January 2015 was the first time in the entire trading range that EBAY bounced off the 200 DMA. The SCTR rankings have recently tested the 75 level twice which is usually a good clue that investor sentiment is changing in the stock. We can see almost two years of a weak SCTR only to finally get some upside enthusiasm after the announcement of the proposed IPO. The purple relative strength trend lines show EBAY underperforming the $SPX for almost two years. It has not started to outperform, but at least the underperformance is changing. The horizontal line in purple makes this stock interesting right here.
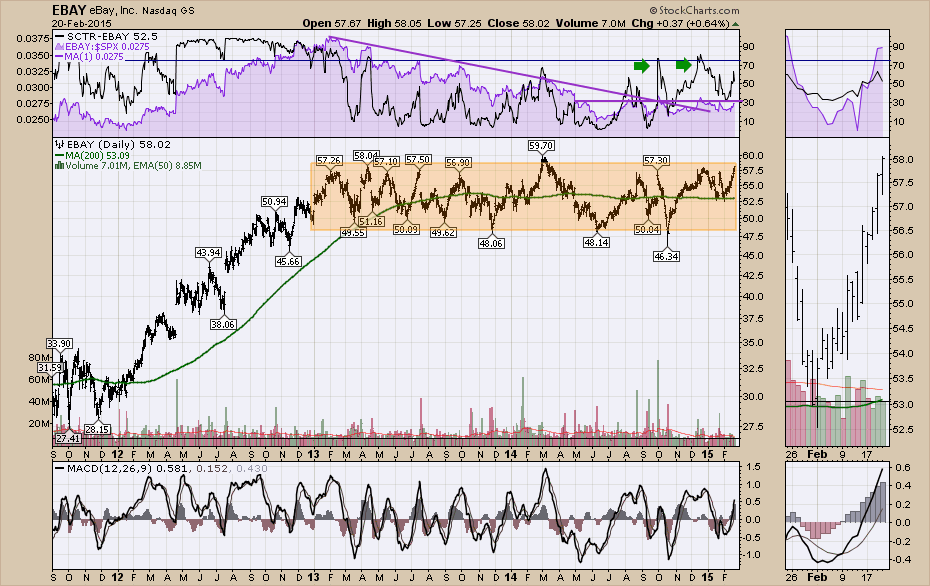
The final two indicators, volume and MACD are two different stories. The volume has dried up on a daily basis making it very interesting. Are we running out of sellers or buyers? Doesn't look like buyers are the problem as they have bid the price up for 15 days in a row. It might be a lack of sellers. The MACD is not very helpful here other than to say you are too late to trade the channel trading range.
The last indicator is price. EBAY made new 10 month highs on Friday. The highs in August and September were also bullish. I think the better clue here is the support at the 200 DMA. This looks like a stock that breakout buyers are starting to get interested in and the channel is about to be broken. I obviously don't know when the IPO date will be announced but the change in the stock is notable here. The 10 month new high on quiet volume shown by the black line makes a good mystery. Ralph Vince suggests being very observant on really high volume or really low volume. Both can be important clues. We can see the average volume has dropped substantially since the September 30th announcement. This suggests to me accumulation over time. When the volatility and the volume drop in the stock, it's usually the calm before the storm. EBAY should be an auction to watch over the coming months.
Good trading,
Greg Schnell, CMT
