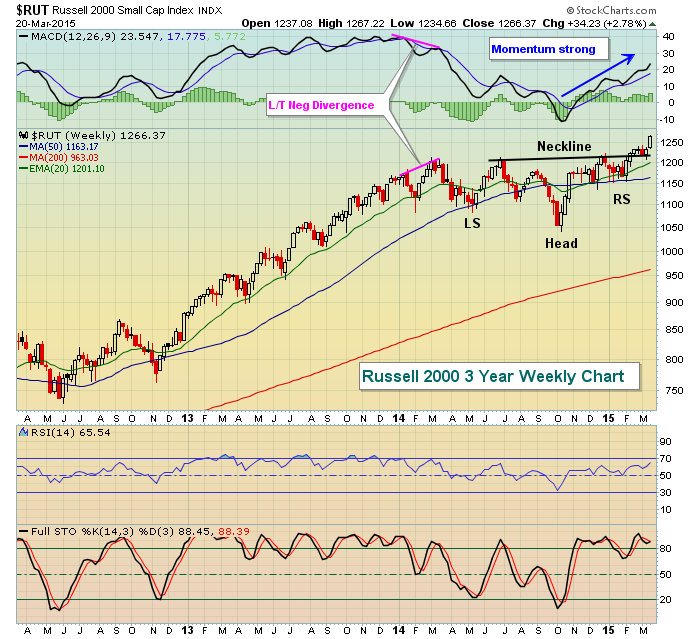
Both the Russell 2000 Index ($RUT) and S&P 600 Small Cap Index (SML) broke out to all-time highs last week as money continued to rotate towards aggressive small cap stocks and that should be seen as a bullish sign for equities. In the case of the $RUT, a year long bullish continuation pattern - an inverse head & shoulders - finally resolved to the upside with a fresh target price of 1400 based on its measurement. Heading into 2014, momentum began to slow for small cap stocks as a long-term negative divergence emerged in March 2014 on the weekly chart. Many times that sets the stage for a selloff, or at least a long period of consolidation. Consolidate is exactly what the Russell 2000 did. Check out the chart:
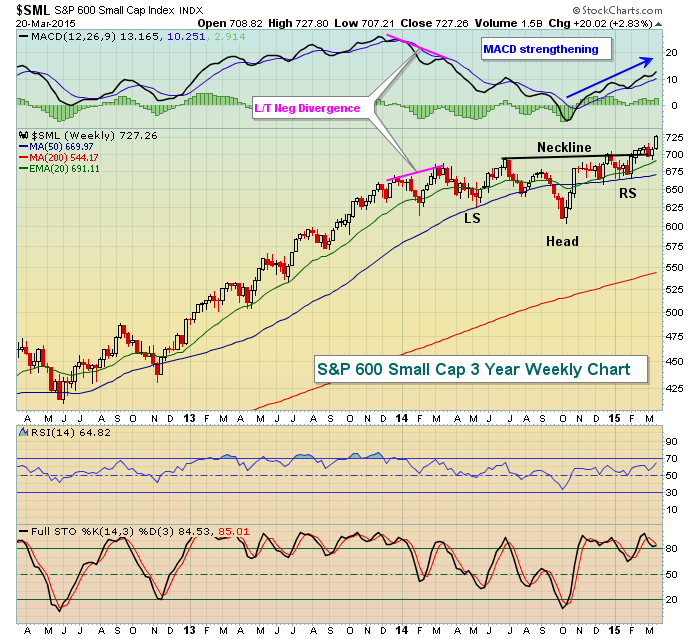
While the S&P 500 was up nicely last week, it's still awaiting its next breakout. Failure to break out, however, did not stop the S&P 600 Small Cap Index ($SML) from breaking out as the pattern here is quite similar to the Russell 2000 with the small cap area of the S&P surging to all-time highs. Take a look at the SML:
Given the strength in small caps, it's very difficult to grow bearish equities at this time.
Happy trading!
Tom
