With a pull back in the US Dollar ($USD), both Gold and Silver started to move this week. We have been discussing it in the webinars, but these are meaningful moves that are just starting as the $USD takes a breather. On Chart 1, I have used the GLD chart to show the move on Friday at midday. It has made a nice double bottom base and the MACD has given a positive crossover signal. The relative strength line in purple has not broken out to the upside yet. The volume has not surged meaningfully yet, but it is an options expiration which usually creates a high volume day so I would expect a large candle by the close. The big bullish candle on Fed day was over 12 Million shares with the average around 7 Million. This looks set to move higher now.
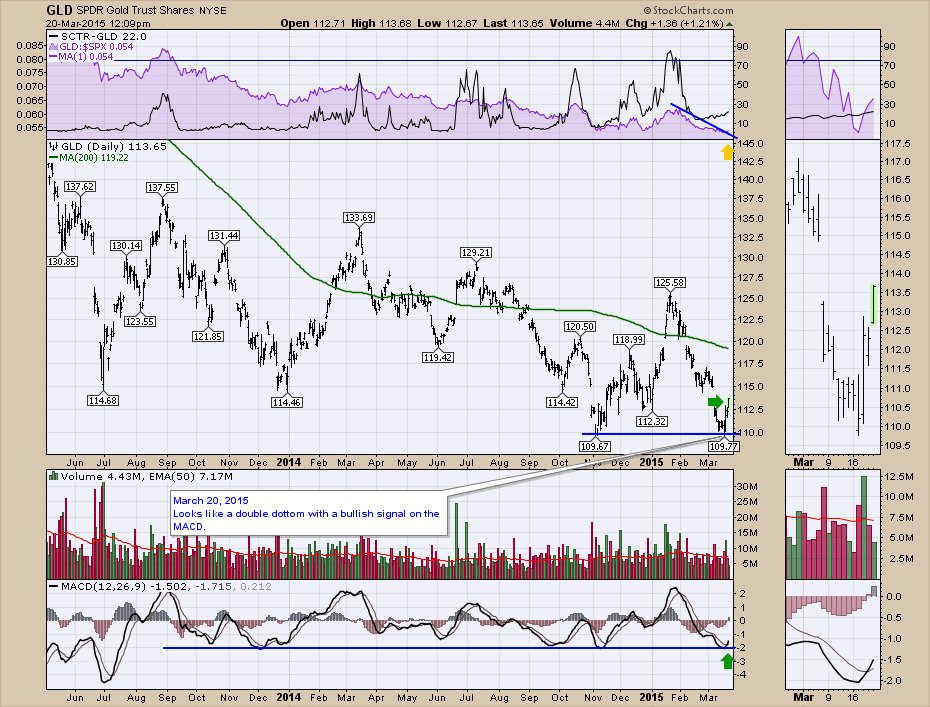
Chart 1
Here is the SLV chart representing Silver on Friday midday. You can see the volume is already above the 50 day EMA with more than half the trading day to go. Again, a nice base formed while testing previous lows and SLV has pushed substantially to the upside already but should have lots of room to run.
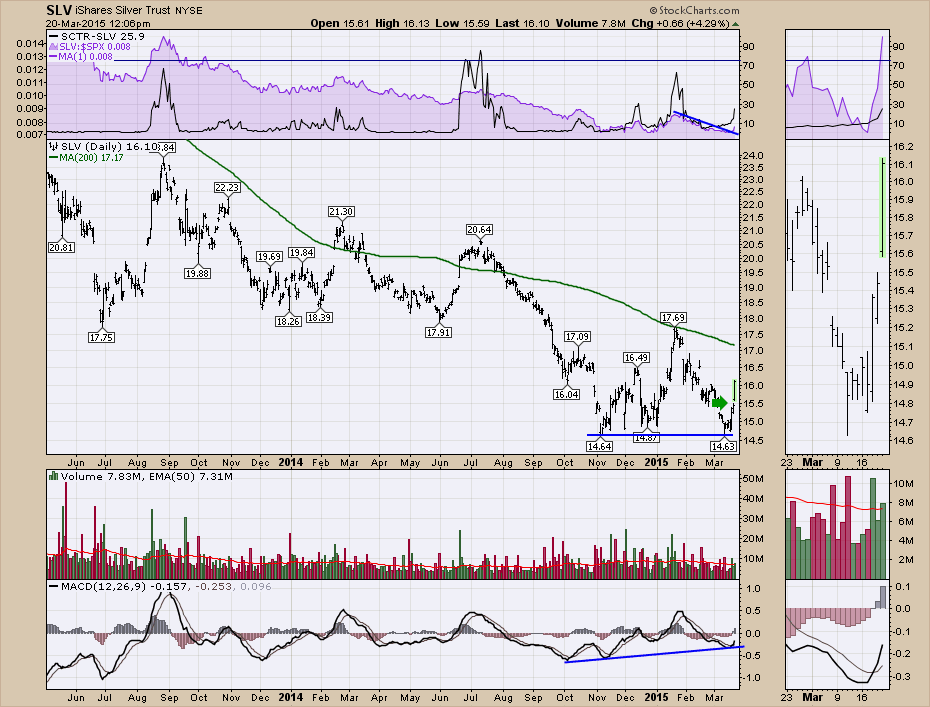
Chart 2
Spring is in the air and Silver seems to have some spring in the chart. Gold looks strong here too if the $USD continues to pull back.
Good trading,
Greg Schnell, CMT
