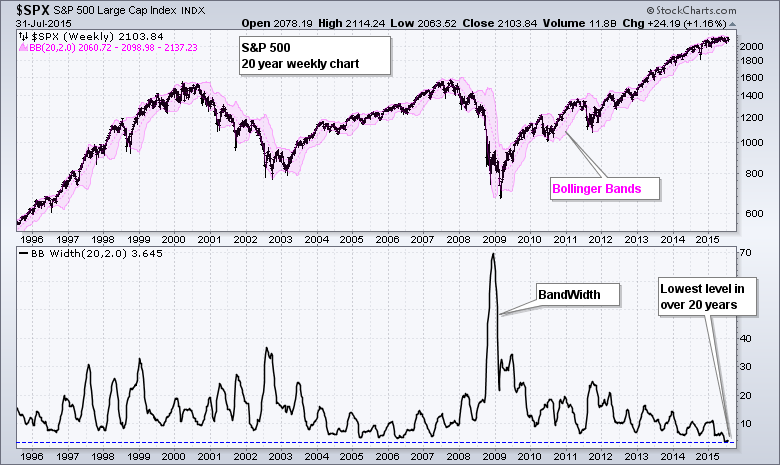
The S&P 500 is locked in a 100 point trading range (2040-2140) since March because of a serious split in sector performance. At less than 5% this is the narrowest range in several years. Note that Bollinger Bandwidth on the weekly chart reached a 20+ year low in July. This means the Bollinger Bands are at their narrowest in over 20 years. How's that for a contraction. John Bollinger theorized that a volatility expansion often follows a volatility contraction. Chartists, therefore, should prepare for significant move in the coming weeks or months. I'll highlight the key levels to watch after the jump.
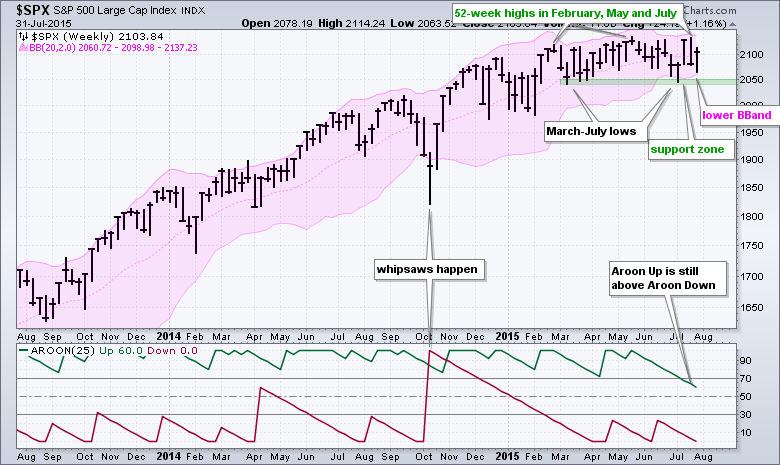
The upper and lower bands mark the first levels to watch for a directional clue. With the index hitting 52-week highs in February, May and July, the overall trend is up and this favors further upside. I would use the lower Bollinger Band and March-July lows to mark key support in the 2040-2060 area. A weekly close below 2040 would show enough selling pressure to forge a support break and suggest a trend change. Chartists can also watch the Aroon oscillators for a bearish cross to signal a trend reversal. Looking for more? Follow me on twitter (@arthurhill) or check out the recording of my webinar from Tuesday.
Thanks for tuning in and have a great weekend!
Arthur Hill CMT
