For many weeks, the DP Scoreboard for the Nasdaq 100 was the most positive in comparison to the S&P 500, S&P 100 and Dow Industrials. In fact, back when the NDX was in the lead with the most bullish signals, the others were grappling with more bearish signals. The "tables" (pun intended) have turned and the NDX is most negative.
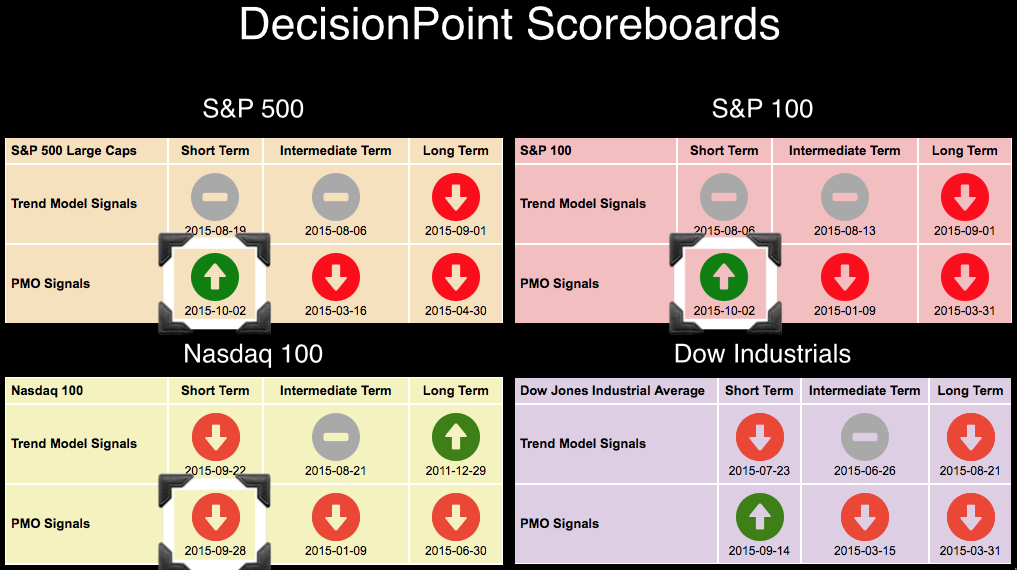
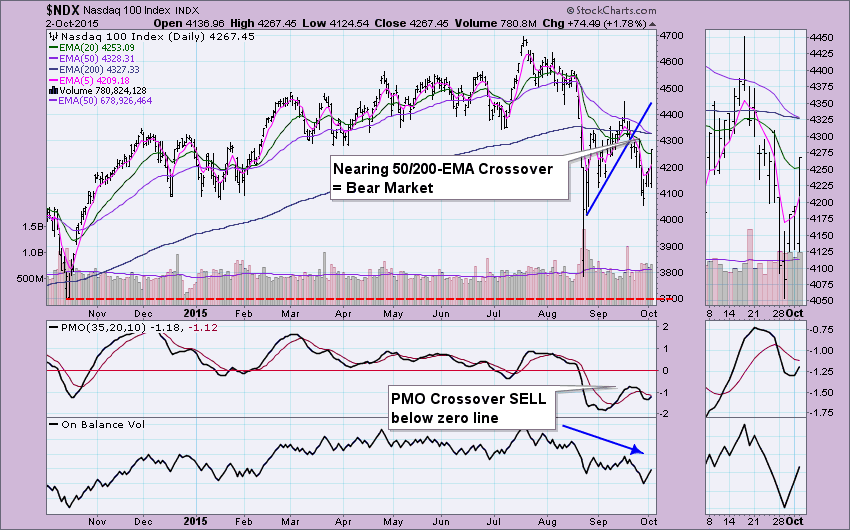
One might point out that the NDX is not in a long-term bear market. That bullish signal will likely disappear early next week. The only way for the NDX to avoid a 50/200-EMA crossover is getting price back above them. That would require a move to at least 4329. Looking at the daily chart for the NDX below, the 50-EMA is less than a point away from the 200-EMA, and, a Long-Term Trend Model BUY. Last week's rally is what caused the recent Price Momentum Oscillator (PMO) BUY signals on the SPX and OEX. More rally next week could push the PMO on the NDX into a BUY signal as well. The margin between the PMO and its signal line is thin, so new short-term bullish signals could follow.
 +
+
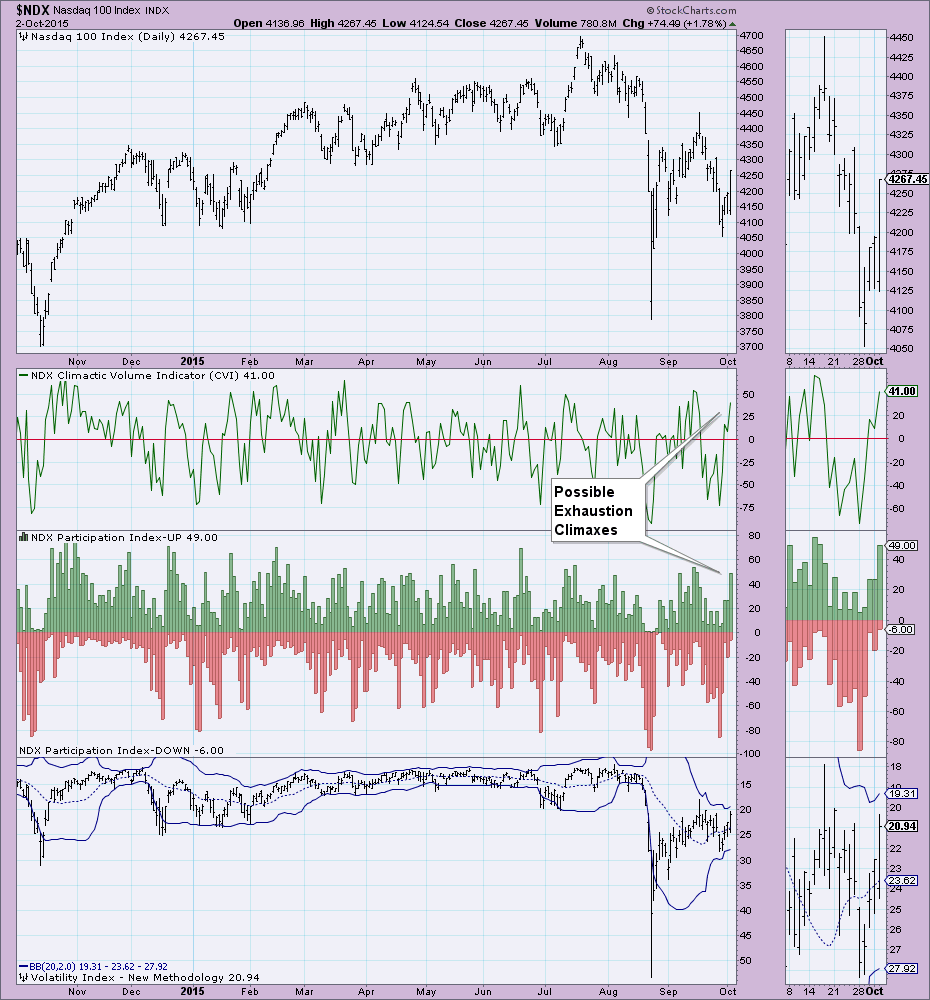
On Friday, our very short-term indicators spiked. (You'll find all of these indicator charts and many more for the NDX using the drop-down menu for members in the DP Chart Gallery) These climactic readings suggest either an initiation or exhaustion. When the positive readings spike on a current rally, that suggests a buying exhaustion. It would be the opposite for downside, a selling exhaustion. These signals don't immediately precede a price reversal, typically you'll see some churn first.
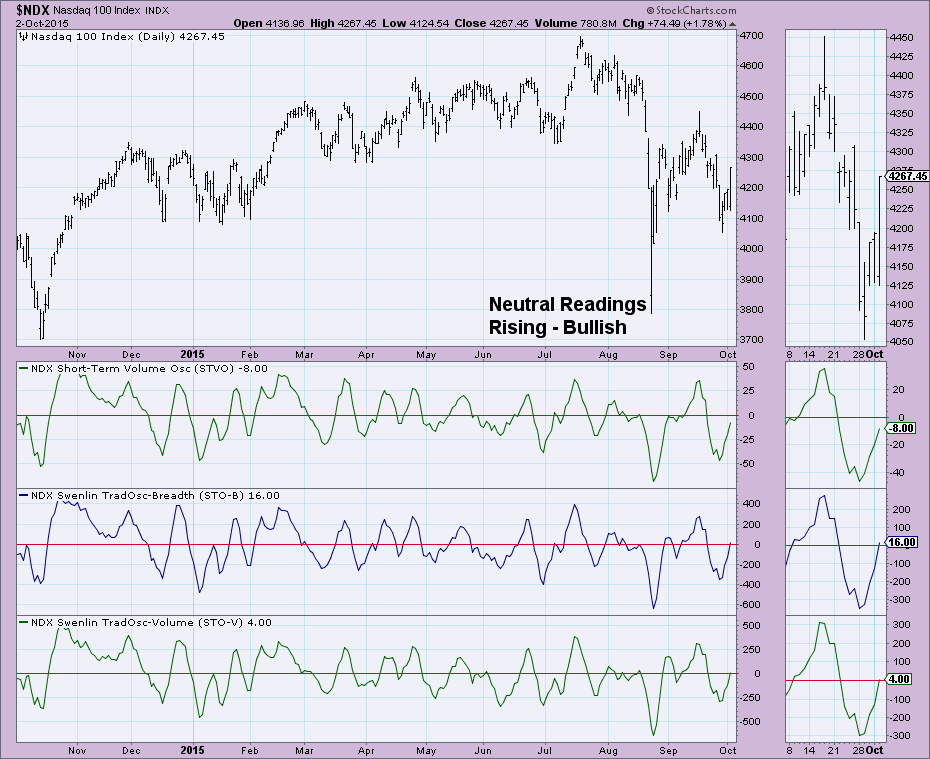
That is completely in line with what is happening to the short-term indicators for the NDX. The short-term indicators for the NDX are rising bullishly and are only in neutral territory. This suggests either more buying or consolidation (churn) on the horizon, at least until they become overbought which in the short term wouldn't take much.
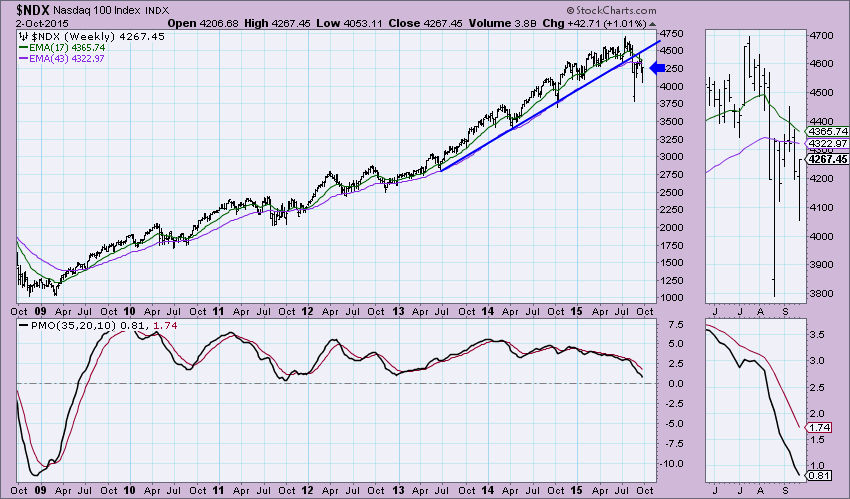
My analysis continues to sway toward a bearish stance. Remember, the longer term sets the tone in the medium and shorter terms. Trends established in the long term require many touches on trendlines over very long periods of time, like in the case below, the rising trendline was established almost two years. This implies the trend is much stronger and is harder to reverse from. The weekly chart shows the NDX long-term breakdown and the failure of price to get back above that long established rising trend.
Conclusion: Three of the major indexes we cover in the DP Scoreboards switched to new PMO BUY signals, just after the NDX switched to its current PMO SELL signal. Very short- and short-term indicators on the NDX suggest more upside, but limited based on the overall bearish bias of the DP Scoreboards and charts in the intermediate to long term.
Technical Analysis is a windsock, not a crystal ball.
Happy Charting!
- Erin
