On the surface, the rout that took place in August has been completely reversed and, three months later, it's like nothing ever happened, right? Wrong. What has happened is that the S&P 500 rose from August 19th's close of 2079.61 to Thursday, November 19th's close of 2081.24 - less than two points - but the rotation underneath is the real story. After the scare off the August lows and subsequent rally, the big question is.....is the rally about to end or are we on the brink of another significant rise in U.S. equities? I believe it's the latter and here's why:
1. Volatility (VIX) suggests that sentiment favors a rally
During the bear markets of 2000-2002 and 2007-2009, we never saw a VIX fall below 16. Not once. Bear markets require a certain level of fear to fuel the impulsive selling episodes. The lack of expected volatility or fear enables the market to shrug off bad news and continue its march higher. Many refer to it as "climbing the wall of worry". There's a lot of truth in it and the VIX helps to provide us a visual. Take a look at a long-term chart of the VIX and the S&P 500:
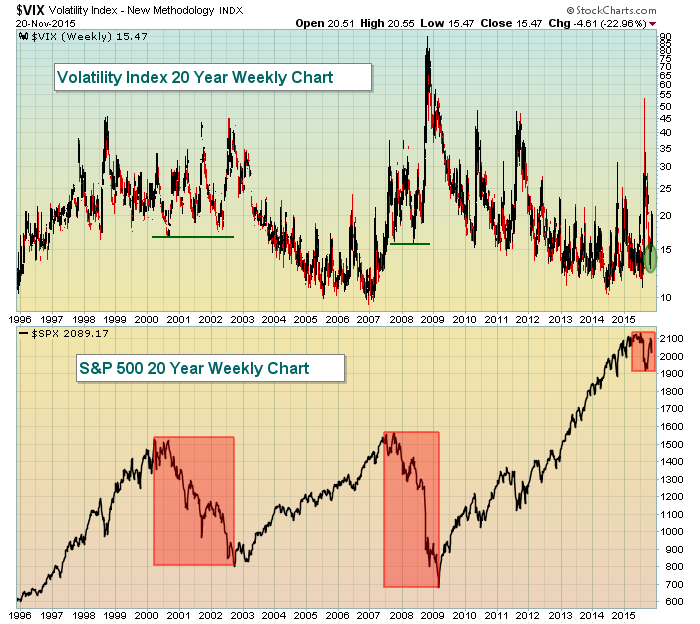
During the past two bear markets, the VIX never dropped below 16, a reflection of nervousness that enabled the bears to maintain control of market action for extended periods of time. Recently, the August selloff coincided with a spike in the VIX above 30, but the ensuing rally calmed the market and the VIX has moved back below that pivotal 16-17 support area.
2. History says odds are firmly on the bulls' side
For purposes of analyzing history, I'll use the NASDAQ as my example. This data dates back to 1971, a fairly representative sample in my view. Outside of the December 7-15 period, which tends to be a period of profit taking or consolidation, November 23rd through December 31st shows positive annualized returns on 24 of the 29 remaining calendar days, including 7 days that show annualized returns in excess of 100%. November 24th has an annualized return of 246.82%, the highest return of any day throughout the year. From November 23rd through December 31st, the NASDAQ has risen 31 of 44 years, including the last 8 years in a row. While the NASDAQ has fallen 13 times during this period, 1973, 1974, 2000 and 2002 are the only years where the NASDAQ has fallen more than 3%. On the flip side, the NASDAQ has risen more than 10% 5 times, 8% 7 times and 5% 13 times during this 40 day holiday period.
3. Rotation continues TOWARDS aggressive areas of the market, a key component of bull markets
The S&P 500 has made up all of the ground it lost beginning with that August meltdown. More important than the recaptured losses, however, is the fact that aggressive areas of the market have attracted more than their fair share of the action on a net basis during the recovery. To illustrate, take a look at the following chart:
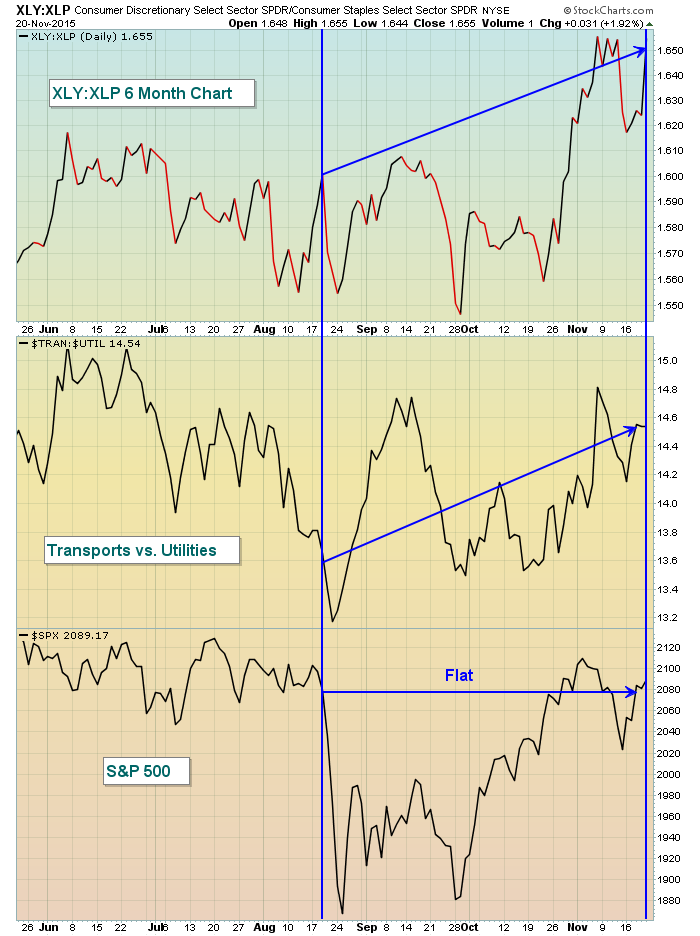
What this chart tells us is that while the S&P 500 has been flat the past three months, money has actually rotated in a major way towards consumer discretionary stocks (vs. consumer staples) and transportation stocks (vs. utilities). This only makes sense when the market is anticipating economic strength ahead. If market participants were anticipating economic weakness or a recession, money would rotate in opposite fashion.
4. October lows held as price support
We haven't broken out above recent highs yet, but the fact that the high volatility, impulsive selling in August held those October 2014 lows suggests there's a higher likelihood we'll continue our long-term uptrend and eventually break out to fresh highs. In its simplest form, a bull market consists of higher highs and higher lows and, for now, that trend remains intact. Check it out:
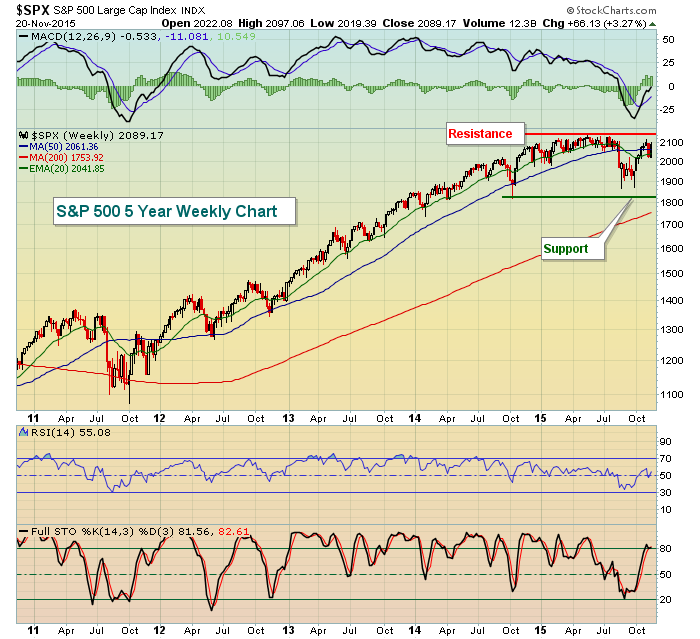
A close above 2131 would signal the next leg higher in this bull market. We can't assume it will happen, but given the other signals above, a breakout would confirm what I believe is already in the works - more bullishness ahead.
Happy trading!
Tom
