Chartists can use the percentage of stocks above the 200-day EMA to rank the sectors based on component trends. Using this breadth indicator, we can separate the weak sectors from the strong and get a good idea of the current market environment. I am working under the assumption that a stock above its 200-day EMA is trending up and a stock below its 200-day EMA is trending down. Chartists want to avoid sectors where the majority of stocks are trending down and focus on sectors where the majority of stocks are trending up. The chart below shows the percentage of stocks above the 200-day EMA for the S&P 500 and the four top sectors in the S&P 500. Note that this chart was created with a StockCharts Extra account, which allows chartists to plot up to six symbols on one chart. StockCharts PRO users can plot up to ten symbols on one chart. I arranged the windows with the highest percentage at the top and the lowest at the bottom.
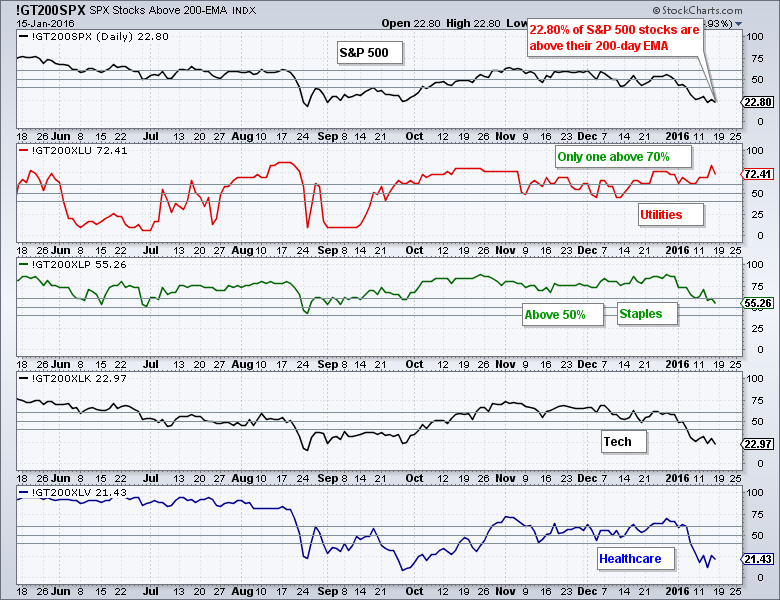
There are several important takeaways here. First and foremost, just 22.8% of S&P 500 stocks are above their 200-day EMA. Second the %Above 200-day EMA is below 50% for just two of the nine sectors. The vast majority of stocks in the S&P 500 are in downtrends and there is widespread weakness throughout the sectors. This indicates that we are in a bear market environment. Utility stocks are holding up the best because over 70% are still above their 200-day EMA. Consumer staples are next with 55%. The drop from here is pretty steep because just 23% of tech stocks are above their 200-day and 21.43% of healthcare stocks are above their 200-day.
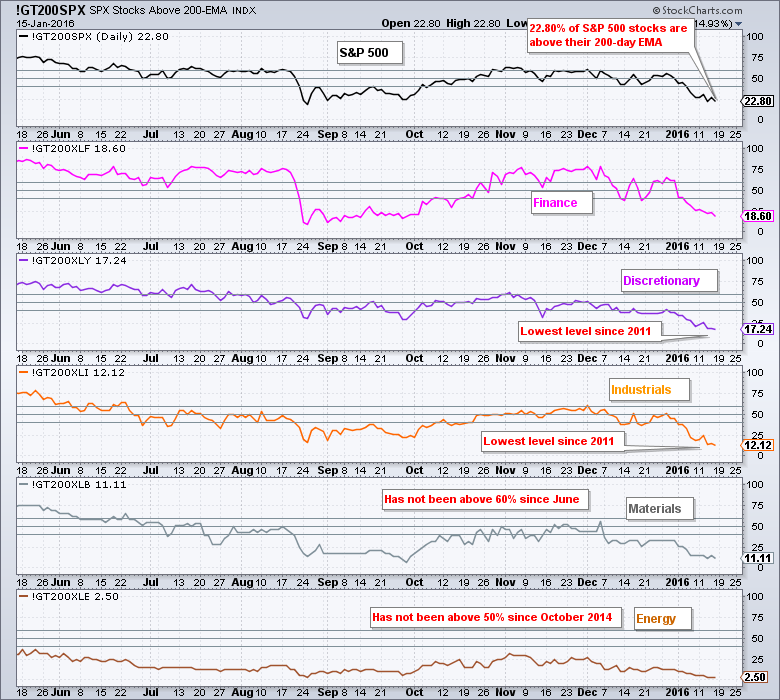
The percentage of stocks above their 200-day EMA is below 20% for the remaining five sectors. Just 17% of consumer discretionary stocks are above their 200-day EMA and this is the lowest level since 2011. Similarly, just 12% of industrials stocks are above their 200-day EMA and this is also the lowest level since 2011. These levels may seem oversold, but the trends are what are important here and the trends are clearly down. A mere 2.5% of energy stocks are above their 200-day EMA and this is indicator has not been above 50% since October 2014. Simply paying attention to this indicator would have kept one out of energy stocks for the last fifteen months.
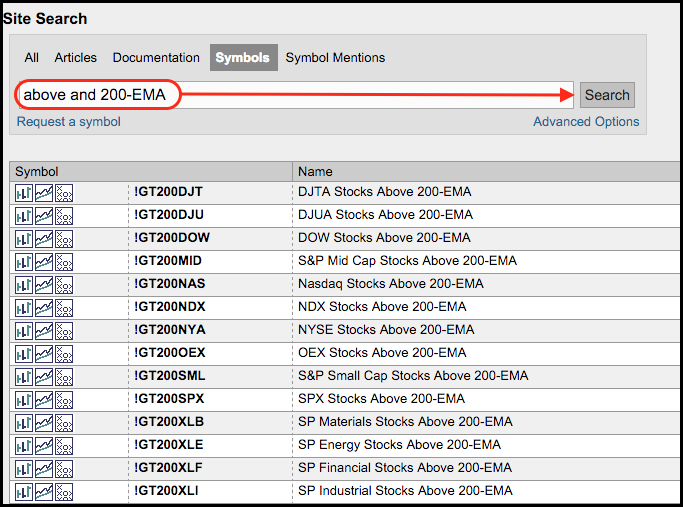
Note that you can also see the percentage of stocks above the 50-day EMA and the 20-day EMA simply by changing 200 to 50 or 20 in the symbol. For example, !GT200XLK would be !GT50XLK and !GT20XLK. Just leave the sector symbols unchanged. This will offer a look at the medium-term and short-term trends. Here is a symbol catalog link with the symbols.
Follow me on Twitter @arthurhill - Keep up with my 140 character commentaries!
****************************************
Thanks for tuning in and have a good weekend!
--Arthur Hill CMT
Plan your Trade and Trade your Plan
*****************************************
