Hello Fellow ChartWatchers!
I know, I know. I've shown the same chart again and again recently. Well, apologies in advance, but here it is one more time:
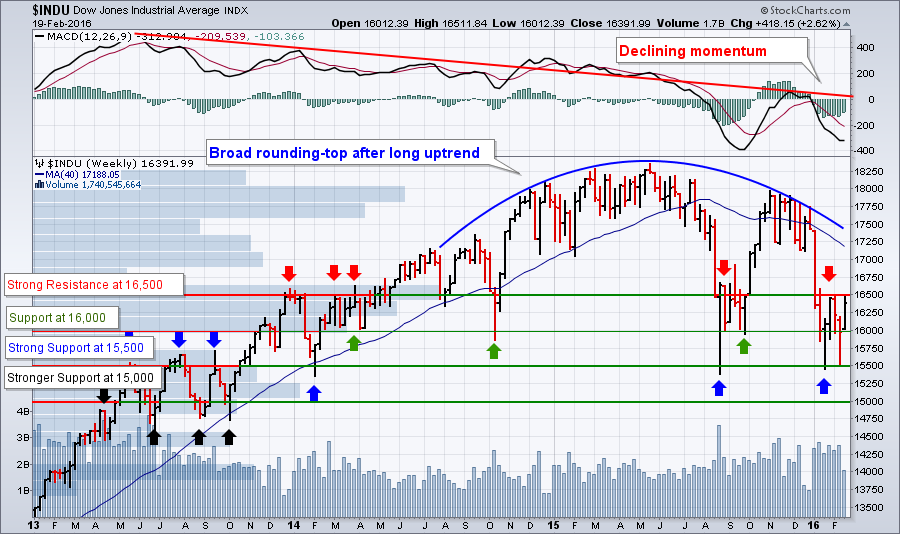 I'm showing it again because I really think it can keep you grounded in the face of emotional short-term reactions to moves that are really just part of a larger pattern. Two weeks ago, the Dow retested the 15,500 level and quickly bounced higher. Last week, it tested the 16,500 resistance level and fell back. Both moves make sense when you consider the bigger picture. To re-review:
- The market has topped and is generally moving lower based on the rounding top pattern and the downward movement of the 40-week (200-day) moving average (blue lines).
- In the shorter-term, things are moving sideways between 16,500 and 15,500. That's a pretty broad range leading to some quick, big moves both up and down.
- I still think a move below 15,500 would be bad and a move below 15,000 would be worse from a technical damage perspective.
- Assuming no big, non-technical event influences things, I'd expect the market to continue moving sideways until the 200-day moving average pulls into range. At that point, the market will feel more pressure to move lower.
The most important thing to remember at this point is that we are currently in a downtrend and we need to respect that downtrend until it is decisively broken. This will be true at least until the Dow climbs back above the 200-day moving average.
Now, don't get confused by that above analysis and think that there aren't any opportunities out there - there are! For technicians, the main point of market analysis like this is simply to set expectations and determine how aggressive to be as a trader. Given the current picture, we should keep our expectations low and our stops tight. We should be more conservative with our stock picks and watch them closely. We should be skeptical of uptrends and respectful of downtrends. Pretty much the opposite of our approach in 2013 and 2014.
So how do we find the legitimate opportunities that are still out there? Again, I'm going to sound a bit like a broken record here - look for stocks with great relative strength and increasing momentum.
Here at StockCharts, the phrase "great relative strength" is synomous with our StockCharts Technical Ranking (SCTR) system. Click here to learn more about "Scooters." Essentially, I'm saying don't even consider stocks with a SCTR value that's less than 90. Why should you? There are hundreds of stocks out there that have a SCTR ranking higher than 90 - let's focus on them.
For astute ChartWathcers, the phrase "increasing momentum" means a increasing PMO value. The PMO is an advanced momentum oscillator that has proven itself in battle as part of Carl Swenlin's DecisionPoint timing models. So I'm also saying let's piggy-back on Carl's work and further narrow down our list of candidates by only looking at stocks with PMO values that are 1.) above zero and 2.) increasing for at least the past couple of days.
For StockCharts members out there, here's what I'm talking about in "Advanced Scan-ese":
[type = stock] and [country = us] and [group is not ETF] and [close > 2]
and [sctr > 90]
and [todays sctr >= yesterdays sctr]
and [yesterdays sctr >= 2 days ago sctr]
and [2 days ago sctr >= 3 days ago sctr]
and [todays pmo line > 0]
and [todays pmo line > yesterdays pmo line]
and [yesterdays pmo line > 2 days ago pmo line]
and [2 days ago pmo line > 3 days ago pmo line]
So, what do we get when we run that scan now? I currently get 29 results from that scan. Among the candidates are:
- Alpha and Omega Semiconductor (AOSL)
- CA Incorporated (CA)
- Estee Lauder (EL)
- Franco-Nevada Corporation (FNV)
- Glu Mobile (GLUU)
- Illinois Tool Works (ITW)
- Nisource Inc. (NI)
(There are others but these are the ones that especially interest me. Just type in those ticker symbols into the "Create a Chart" bar near the top of our webpages to see why.)
Now, I'm not saying you should buy any of these stocks sight unseen. I am saying these stocks are worth your time investigating and I am using them as proof that there are opportunities in any market - bullish or bearish.
Rawr!!!
- Chip
