2016 has been a very good year thus far for the energy sector (XLE) as it's gained 17.51% in just the last three months alone. Unlike many of the other sectors that have been battling slowing momentum in the form of negative divergences, momentum remains very strong for the XLE on the daily chart. Check out the three month chart:
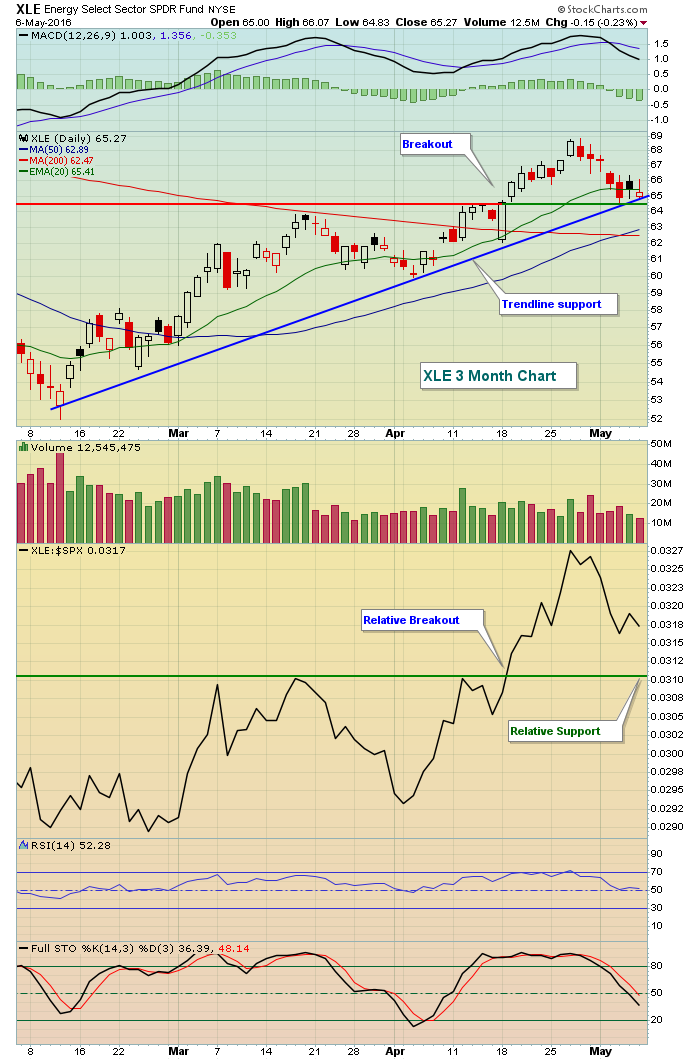 In addition to recently breaking out on an absolute basis, energy has been performing exceptionally well relative to the S&P 500 where we've also seen a breakout. The recent selling likely is providing a late entry into this sector for those who have missed the initial move. I'd be careful if the 64.50-65.00 area fails to hold as support, though, as it's been a very critical pivot area over the intermediate-term. Here's a chart of the XLE over the past couple years:
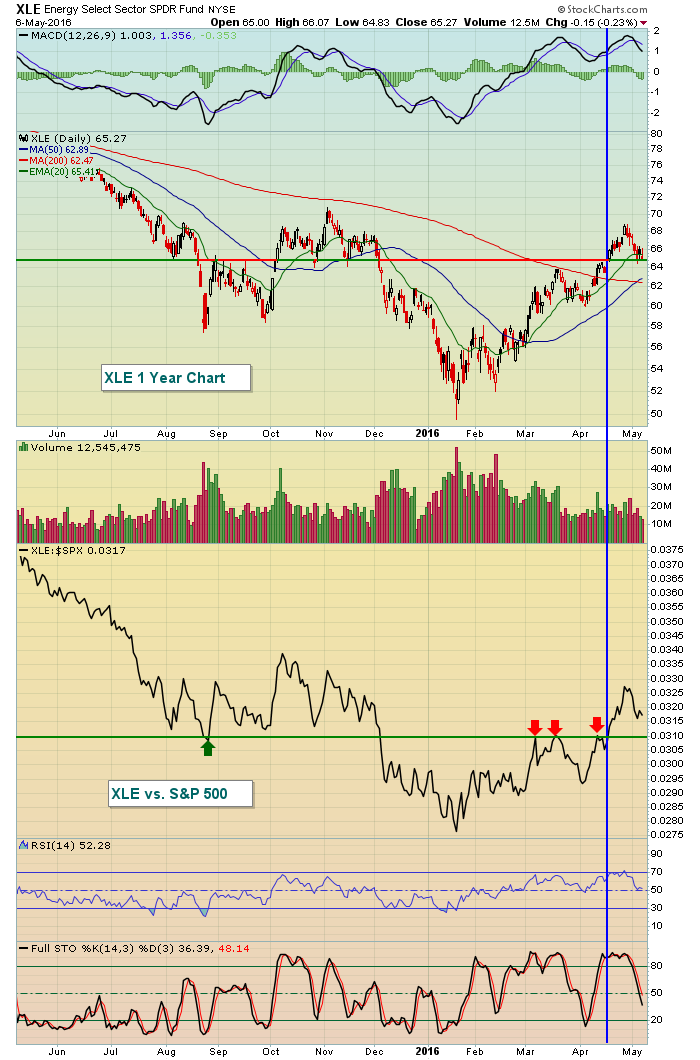 The blue vertical line marks both the absolute and relative breakouts. The horizontal line on the price chart shows that 64.50-65.00 has provided both excellent support and resistance over the past year, so it's important for the bulls to support the XLE at that level and so far they have.
I would continue to look for leadership from energy until both price and relative support are lost.
Happy trading!
Tom
