We've entered a very strong historical part of the year for our major indices and most sectors and industry groups. Today, I want to focus on one of the best of the best, the Dow Jones U.S. Steel Index ($DJUSST). Average DJUSST monthly gains over the past 17 years are as follows from October through December:
October: +2.8%
November: +4.3%
December: +4.3%
Those are average monthly gains over a 17 year stretch. Given this historical strength, it would seem like a good time to evaluate the technical merits of the group. So let's check out the longer-term weekly chart:
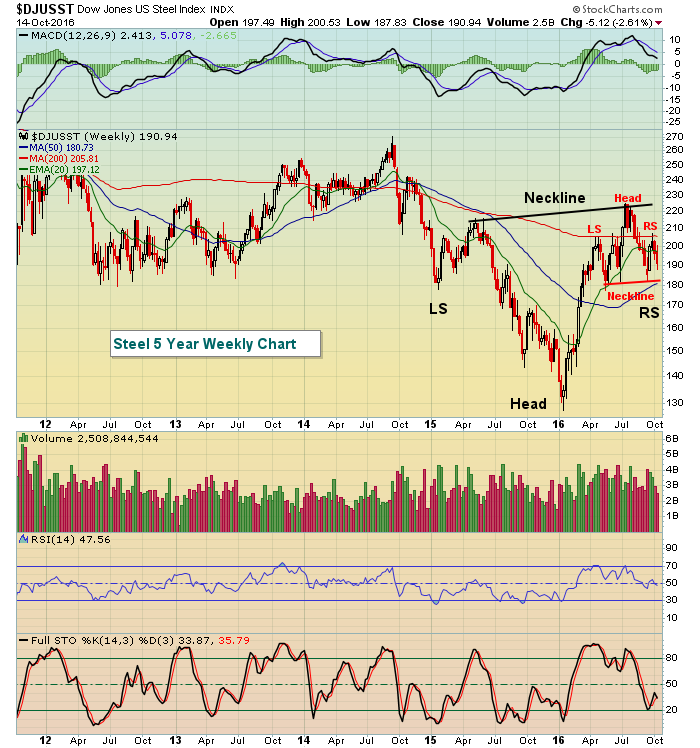 So is the glass half empty or half full? I see two head & shoulders patterns - one bullish and one bearish. But neither are confirmed until we see the heavy volume breakout. Therefore, the two necklines are what I'd be paying attention to. That gives us a trading range of 180-225. But because of the historical tendencies of steel over the next few months, I'd give the technical edge to the bulls. It also helps that the DJUSST is trading much closer to short-term neckline support of 180 than it is to long-term neckline resistance of 225.
Happy trading!
Tom
