With the big swing this week, some of the foreign markets are retesting breakouts. Below are just a few markets to watch in the next few weeks.
Australia ($AORD) failed to hold the breakout to new highs and has now lost the 10 WMA. While losing the 10 WMA is not that big of a deal, the size of the downward stroke right after trying to break through previous highs suggests not a lot of support for the breakout. The 40 WMA is just below and the first test of the Moving Average is usually a bounce. The lower channel is around 5400 with the 40 WMA about halfway in the channel.
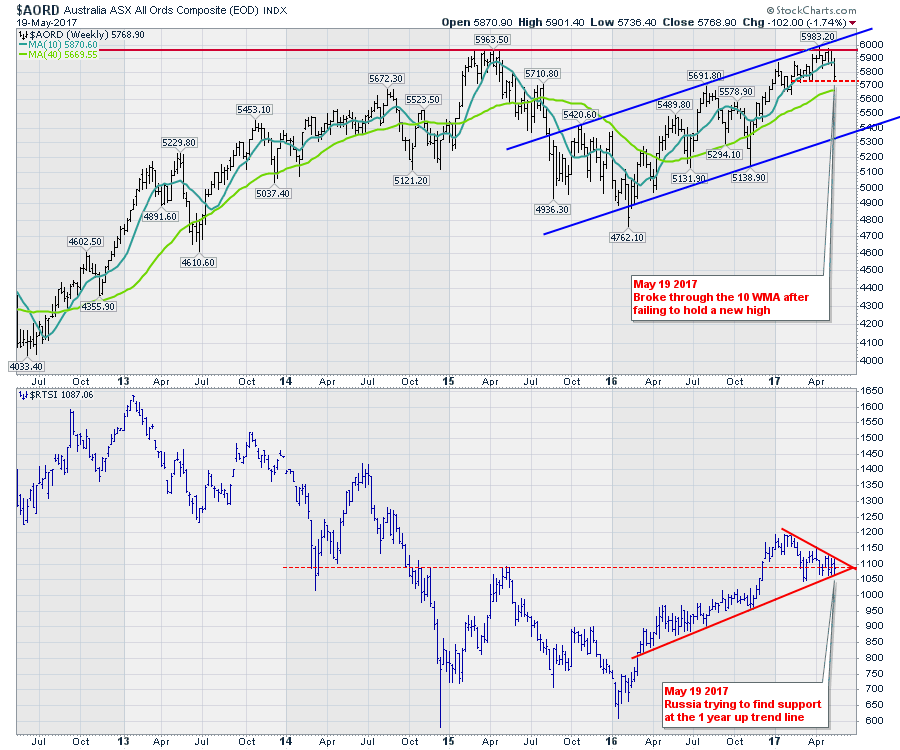
Staying with the chart above, Russia ($RTSI) is in the lower panel. The $RTSI tested both the lower side and the upper side of the range this week with trend line touches on both. The dotted horizontal line represents a major support resistance level going back to 2014. With oil trying to stay in the $50 range, this chart could be volatile either way. With a double in the price for $RTSI last year, a pullback to 900 would only be a 50% retracement. The next few weeks should suggest a direction.
Moving to Chart 2 with the Japanese Nikkei ($NIKK), 20,000 is a pretty important area on the big picture. The 20,000 level is where the retest died in 2015. The Nikkei spent four months going sideways from December 2015 to March 2016 but was unable to make a new high. Last week, the $NIKK traded up to a new 52 week high, only to turn around and break down again, filling last weeks gap. There is a real potential for a Head-Shoulders base (16,900-14865 - 18224) to be building with a long term upside target of 25,000 if it can get going. Conversely a break down through 18750 would snap the uptrend. The continual failing at resistance makes this a must watch market as a lot of markets are influenced by the related Japanese Yen as well.
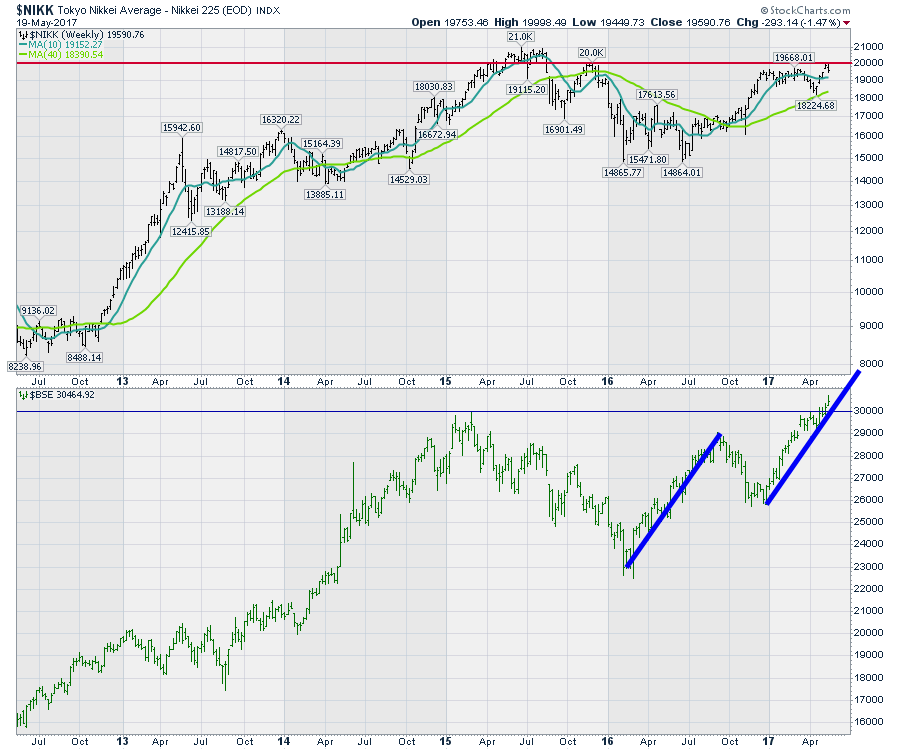 In the lower panel of the chart above is the Bombay Stock Exchange ($BSE) in India. The Indian market has the best demographics in the world. Last week it soared above the previous highs suggesting it is on its way to 32000 using a measured move for a target. 30,000 is now important support for India.
Moving to the French and German markets on the chart below, there are some interesting patterns.
The big European markets posted an outside bar only a week after the French election of PM Macron on May 7. While this may turn out to be nothing, it couldn't find a better, more champagne like, spot on the chart to build an outside bar. For technicians, we need to raise our glasses and see if the froth is running over. Let me explain.
After bubbling to new highs on the assumption Macron would win, the week immediately following the election shows a price bar of indecision or lack of momentum. The candle for the week of May 8th is a small range move with the French market ($CAC) closing the week below where it opened on Monday following the resounding election results. The week opened with the French market gapping to a new high, only to reverse and trade down in a tight range and closing below the Friday before the election. The week of May 15th is the last bar on the chart shown. It traded down but managed to close Friday moving back above the 2015 highs shown by the red line. This is a classic reversal pattern if it plays out. Why is that a classic reversal pattern? A little more detail helps us. When everyone jumped on the bandwagon of new highs, they will all be in a losing money position if the gap fails to hold leading to more selling. The 10 WMA has been support going back to November. The blue line of the 10 WMA is currently at 5186. Obviously, a failure to hold the highs would be quite detrimental to the near term view. The huge gap on the chart will make for an important barrier.
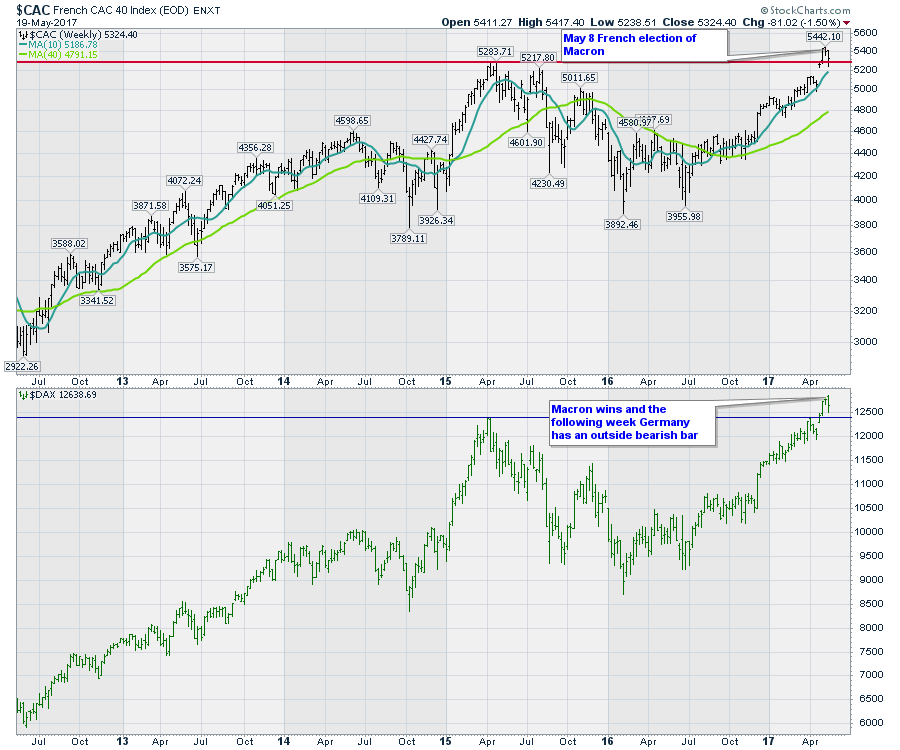 Looking at the lower panel on the chart above, the German market ($DAX) also shot euphorically to a new high on the assumption Macron would win. It closed the May 9th week above the previous week, but now has an outside bar. The previous high at 12390 is an important support level now.
Lastly the Canadian chart and the Brazilian chart both had blowouts to the downside.
The Canadian chart ($TSX) in the top panel failed to hold the breakout above previous highs back in February. This week the Canadian chart made new lows for 2017 which is one of the few country charts in the world with that claim to fame. It traded back up to close out the week near the middle of the range but we can see the closing price is below the uptrend line.
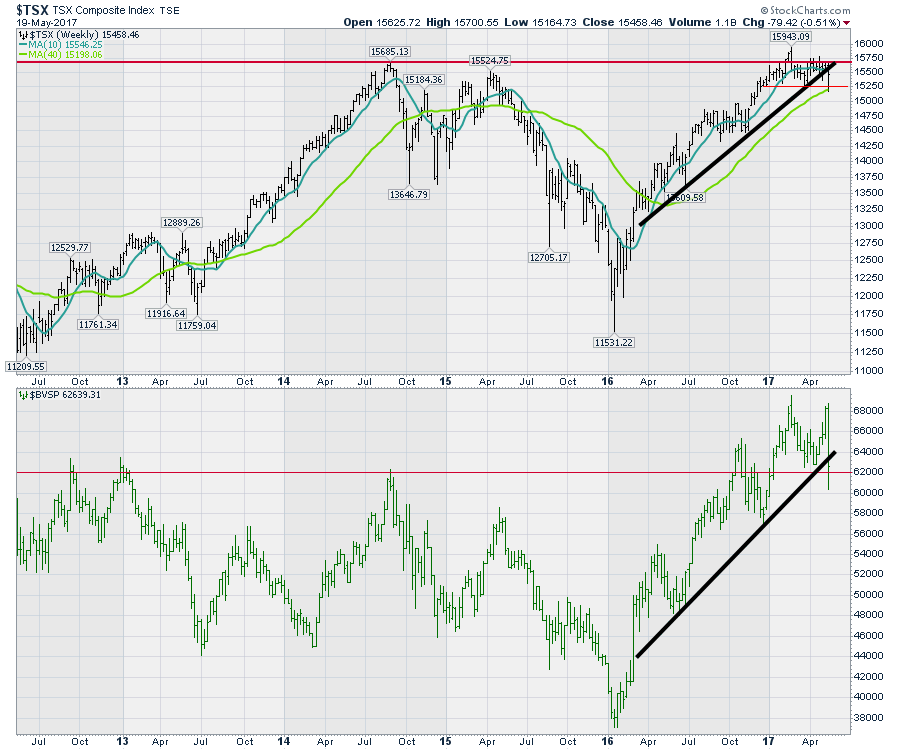 The Brazilian market ($BVSP) in the lower panel got beat up really bad this week on some political corruption news. While trying to push up and test the previous highs at 69500, the market fell hard and had an outside bar that broke to new four month lows. The final closing price for the week closed below the trendline. Looking left on the chart, the 62000 level is pretty important for Brazil. A close below 59000 would be a new 2017 low.
I recorded some important video recordings for both the Canadian and US markets. They can both be found on the Vimeo Channel. The Commodities Countdown video generated a lot of discussion and feedback. I recorded the Commodities Countdown version on Wednesday night after the market drop. There are some interesting trends and the charts are conveying an important message. Click the big gray 'Follow' button on the Vimeo Channel if you would like to be notified when I post a new recording.
If you would like to be emailed when I post my blog articles, click on the Notify Me button at the bottom of each blog to receive fresh articles in your email. You can also follow me on Twitter @Schnellinvestor. Thanks for the follow and have a great week.
Regards,
Greg Schnell, CMT, MFTA.


