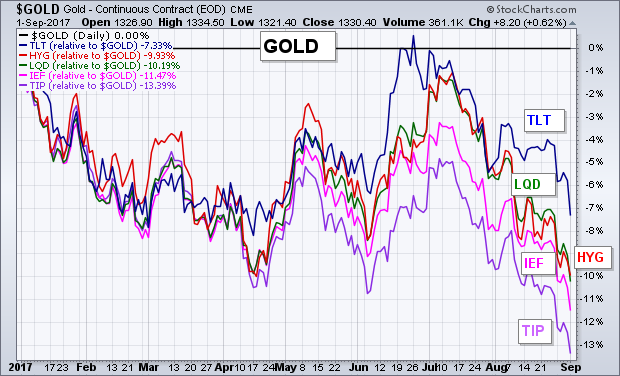
During the week, I wrote about gold (and gold miners) achieving upside breakouts and outperforming stocks for the first time since 2011. Gold, however, is also doing better than bonds for the first time in six years. Not just some bond categories, but all of them. The chart below plots five bond ETFs relative to the price of gold (flat black line) since the start of the year. And all five categories are underperforming the metal. They include long and intermediate term Treasury bonds, investment grade and high yield corporate bonds, and Treasury inflation protected securities (TIPS). And the size of their relative weakness is signifcant in some cases. TIPS, for example, are down more than -13% relative to gold. The 7-10 Year Treasury Bond iShares (IEF) have lost more than -11% versus the metal. Investment grade and high yield bonds are lagging behind by -10%. The strongest bond category for the year, which is the 20+Year Treasury Bond iShares (TLT), is down more than -7% against gold. A weak dollar during 2017, low interest rates, and recent flights to safe havens have benefited both bonds and gold. But investors appear to be favoring gold assets over the safety of bonds.