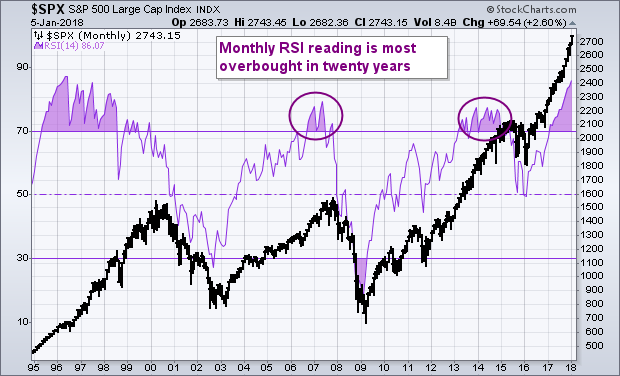
Global stock markets started off the new year with a bang. U.S. stock indexes exploded to record highs for the best start in years. Foreign stock benchmarks did the same, including the FTSE All World Stock Index which also hit a new record. New records were set in North America, Europe, and Asia and in both developed and emerging markets. So what's there not to like? Well, there is one thing. Stocks are very stretched on a historical level. That may not be a problem at the moment. But could become one later in the year if some things start to go wrong. But first let's look at how much stocks are stretched. The black bars in Chart 1 compare monthly bars for the S&P 500 to a 14-month RSI line. Readings over 70 show a major overbought condition. The last two times that happened was in the 2006/2007 period and in 2014 (circles). The earlier condition led to a major downturn in 2008. The later version led to a downside correction in 2015 in excess of 10%. What really jumps out in Chart 1, however, is that the monthly RSI reading of 86 is higher than both of those two prior peaks. In fact, it's now at the highest level since the late 1990s. That puts the S&P 500 at the most overbought level in twenty years. That's not necessarily a bad thing over the short run. But it is a caution sign that things may have gotten a little too good. The 14-week RSI line has now risen to the highest level since 1958. That's sixty years ago. That makes me a little nervous that 2018 may not end as well as it started.
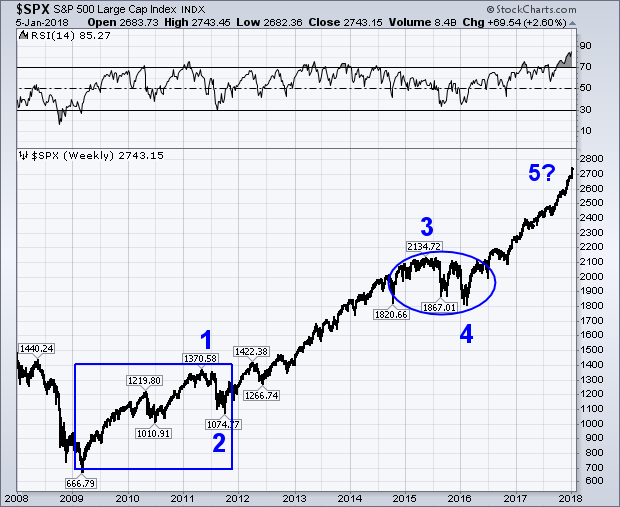
During the market's last downside correction which lasted from spring 2015 to February 2016, I did an Elliott Wave analysis on the market's uptrend since 2009. I pointed out at the time that S&P 500 appeared to have comleted three waves of a normal five wave advance. That meant that the 2015 correction was a normal fourth wave pullback and not a final top. That meant that another upleg was likely. That's the circled area on Chart 2. And that has certainly been the case. The numerals superimposed on Chart 2 bring that earlier chart up to date, and suggest to me at least that the market is well into its fifth wave since the 2009 bottom. [Elliott Wave Analysis is based on the idea that stock uptrends have five waves -- three upwaves (1,2,3) with two intervening corrective waves (2 and 4)]. Elliott Waves aren't infallible (nor are people who use them). But it is something that concerns me. So does the fact that the 14-week RSI line (top of chart) has now reached the most overbought level (85) since the bull market started in spring 2009. One final point. One of the oldest ways to determine how far an uptrend might go is to triple the size of the first upleg. That's the boxed area from the spring 2009 bottom to the spring 2011 peak. That first upleg measured 704 points (1370-666). By tripling that value to 2112 (704x3) and adding it to the 2009 bottom of 666, we get an eventual upside target to 2778 for the S&P 500. That's only 35 points above Friday's closing price of 2743. Of course, markets often overshoot those targets. But it's worth paying attention when long term price objectives are reached. [The idea of tripling the size of the first upleg comes from Dow Theory which holds that markets have three major uplegs. That supports Elliott Wave Theory which also has three upwaves].