Fear ramped up with the early February selling and a capitulatory bottom (at least short-term) printed. The Volatility Index ($VIX) doesn't hit the 40-50 zone often and, when it does, it typically coincides with a panicked selloff and bottom. The last time we saw panicked selling (before the past few weeks) was in August 2015. Let's take a trip down memory lane:
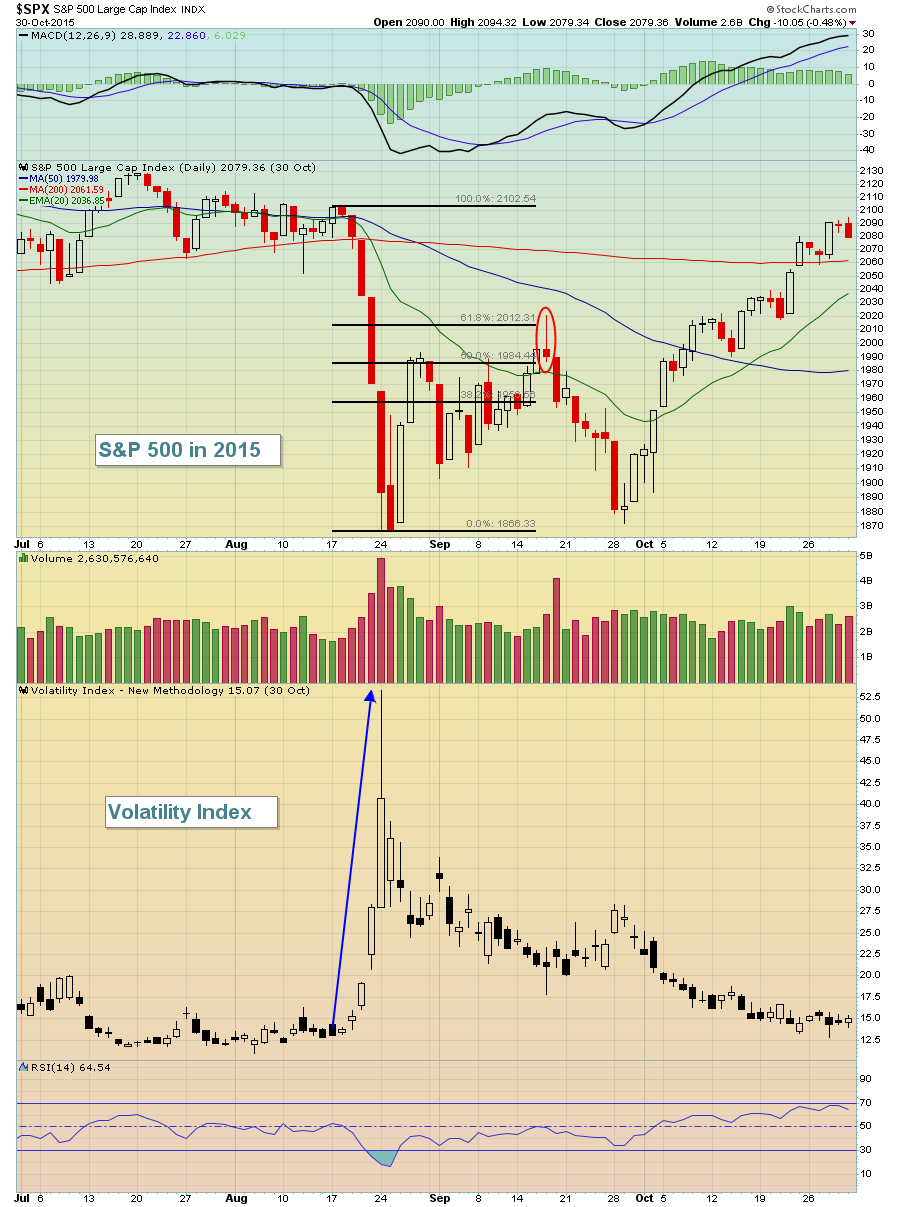 The drop was a little more than 10%, the VIX spiked to 50, a major counter trend rally topped at the 61.8% Fibonacci retracement level and we experienced a false breakout above the 20 day EMA - all with a topping shooting star candle. When you look at the past few weeks' action, you might first think you're looking at the 2015 chart. Here's the 2018 version:
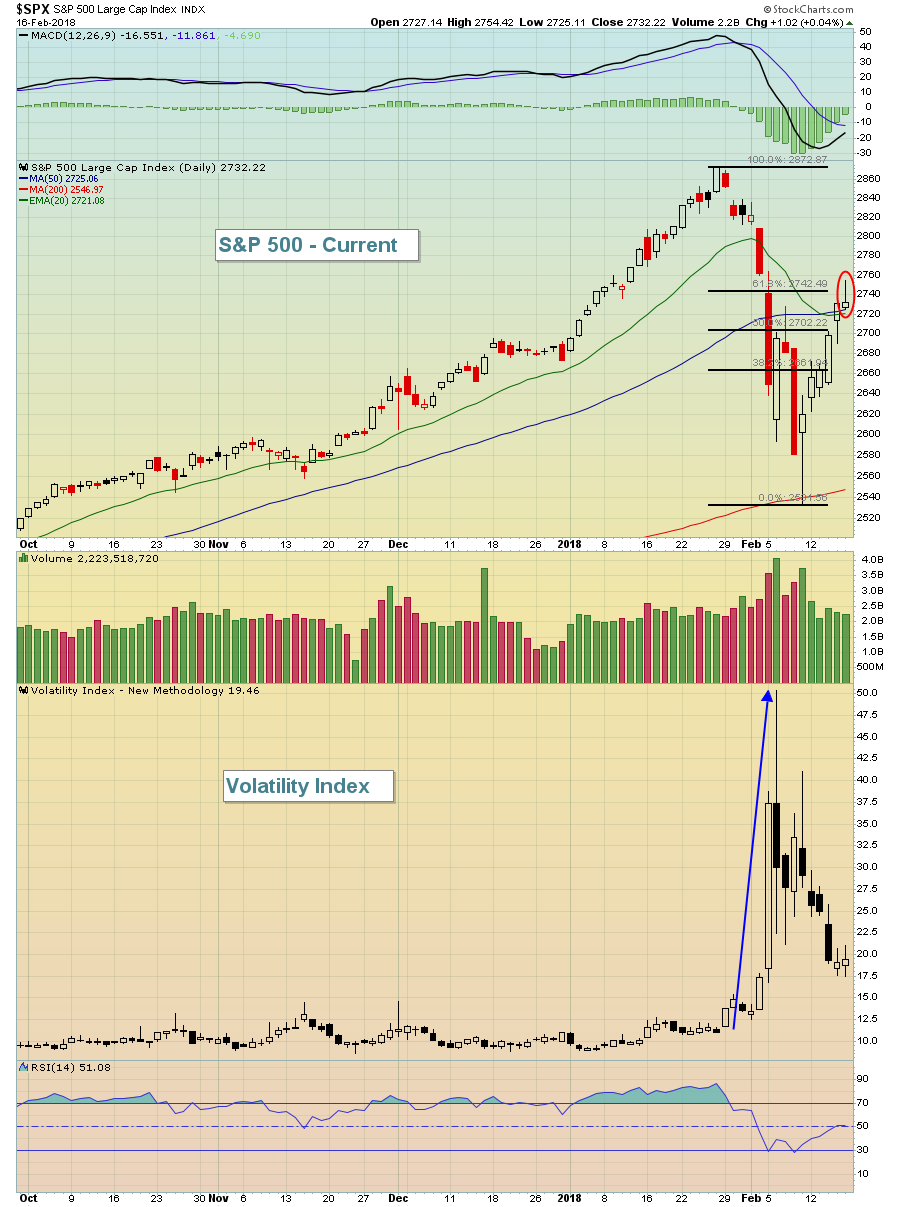 The drop was a little more than 10%, the VIX spiked to 50, a major counter trend rally has potentially topped at the 61.8% Fibonacci retracement level and we could be experiencing a false breakout above the 20 day EMA - all with a topping shooting star candle.
As Yogi Berra might say, "It's deja vu all over again!"
I'm a believer in this bull market and I do not believe this 9 year bull market has ended. This is not, in my opinion, the beginning of a bear market. This was a case of the market going up too far and too fast without a correction. The psyche of traders was such that no one was expecting a correction. The market action was too rosy. The sudden selling episode spooked traders and it will likely take awhile to shake out all the weak hands before the market resumes its upward trend. So I'd look for the path of least resistance to be downward in the near-term, although bull markets can fool everyone. If we clear Friday's intraday high, we could see a "V" bottom as the bull market marches on. But it's clear to me that we've reached a pivotal level and I suspect the bears will be out in full force next week. Over the next couple weeks to few months, I expect a bullish continuation pattern to develop. Maybe it'll be a triangle. Maybe it'll be a bullish wedge. I don't know what shape or form it'll take, but that's what I'll be looking for.
As I posted in my Trading Places blog early last week, history favored the bulls from February 10th through 15th, but this upcoming week history favors the bears. Here are the annualized returns on the NASDAQ since 1971 for each of the two weeks:
February 10th through 15th: +46.48%
February 16th through 22nd: -28.59%
I also had posted in my Trading Places blog on February 7th, "I'll Step Out On That Limb, The Bottom Is In" that I felt we had seen capitulation. It was based on the panicked-type selling and reversal we saw. While we did briefly move 2% below that initial low, I do think this low served as a major bottom for the U.S. stock market as we move forward. Feel free to check out this blog article and subscribe if you'd like. Simply scroll down to the bottom of the article, type in your email address and click the green "Subscribe" button. It's FREE and I'll provide you with what you need to know before the market opens each day!
Happy trading!
Tom
