ChartWatchers May 20, 2018 at 12:46 AM
The S&P hit its all time high of 2872 on January 26, less than 4 months. ago. Two weeks later, on February 9, it touched 2532, having fallen almost 12% before recovering some... Read More
ChartWatchers May 20, 2018 at 12:39 AM
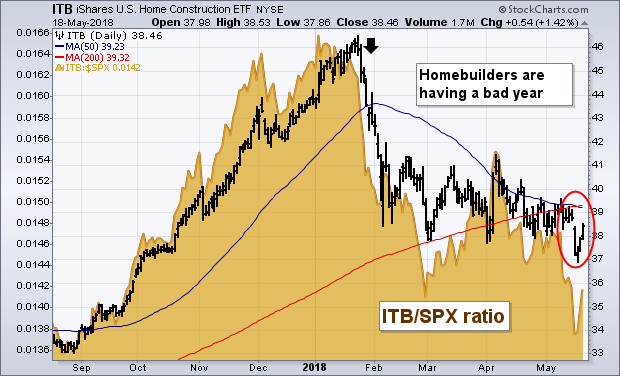
Editors Note: This article was originally published in John Murphy's Market Message on Saturday, May 18th at 9:17am EST. The first page of today's Wall Street Journal carries the headline: "Era of Ultracheap Mortgages Ends as Rates Hit 7-Year High"... Read More
ChartWatchers May 19, 2018 at 09:43 AM
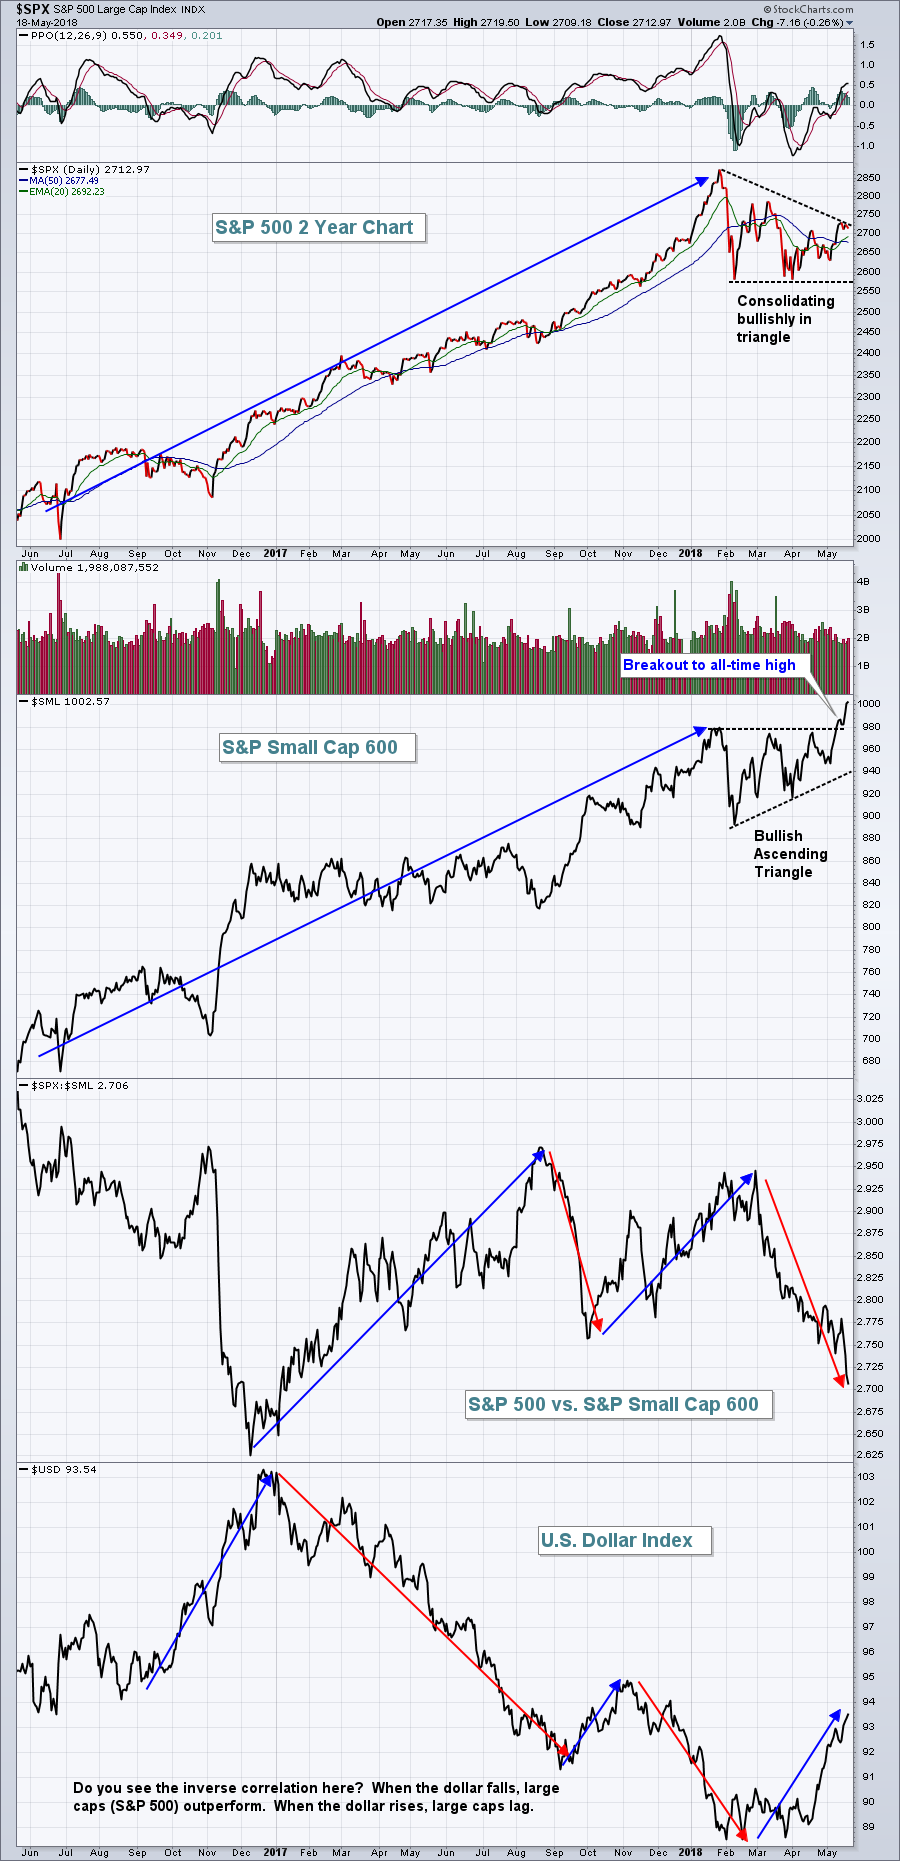
There's a raging bull market going on right now, but you might not realize it if you're stuck in the S&P 500... Read More
ChartWatchers May 19, 2018 at 04:41 AM
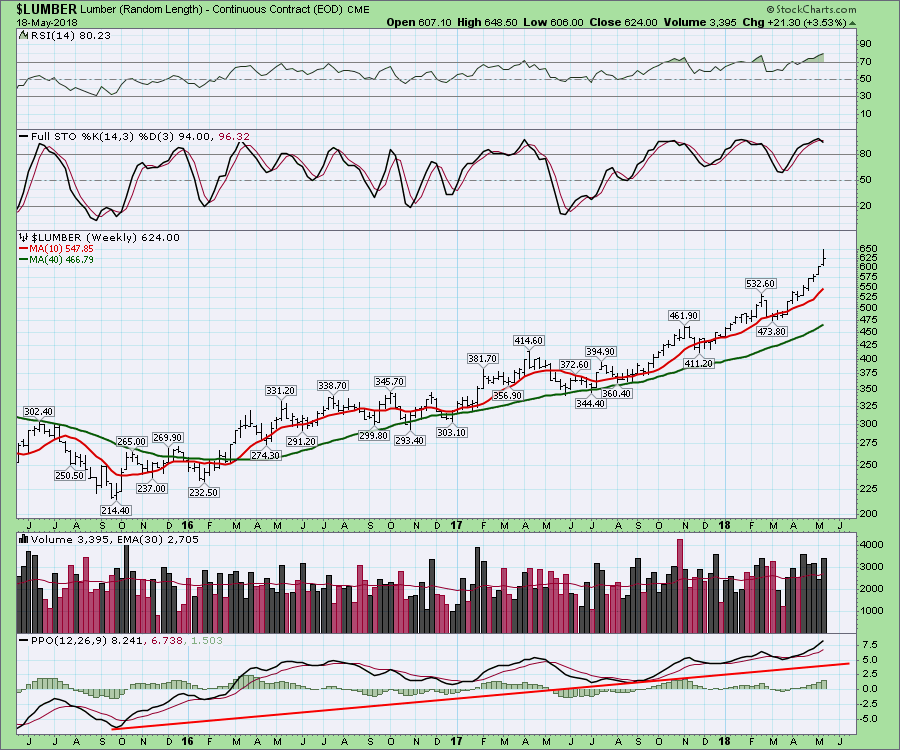
The continuous contract chart of $LUMBER has been on a tear recently. This week the price was almost $200 above the 40-week moving average... Read More
ChartWatchers May 19, 2018 at 03:50 AM

Stocks recording new 52-week highs are the leaders and a key component to broad market strength. Small-caps are doing their part with plenty of new highs, but large-caps and mid-caps are lagging in this category... Read More
ChartWatchers May 18, 2018 at 04:16 PM
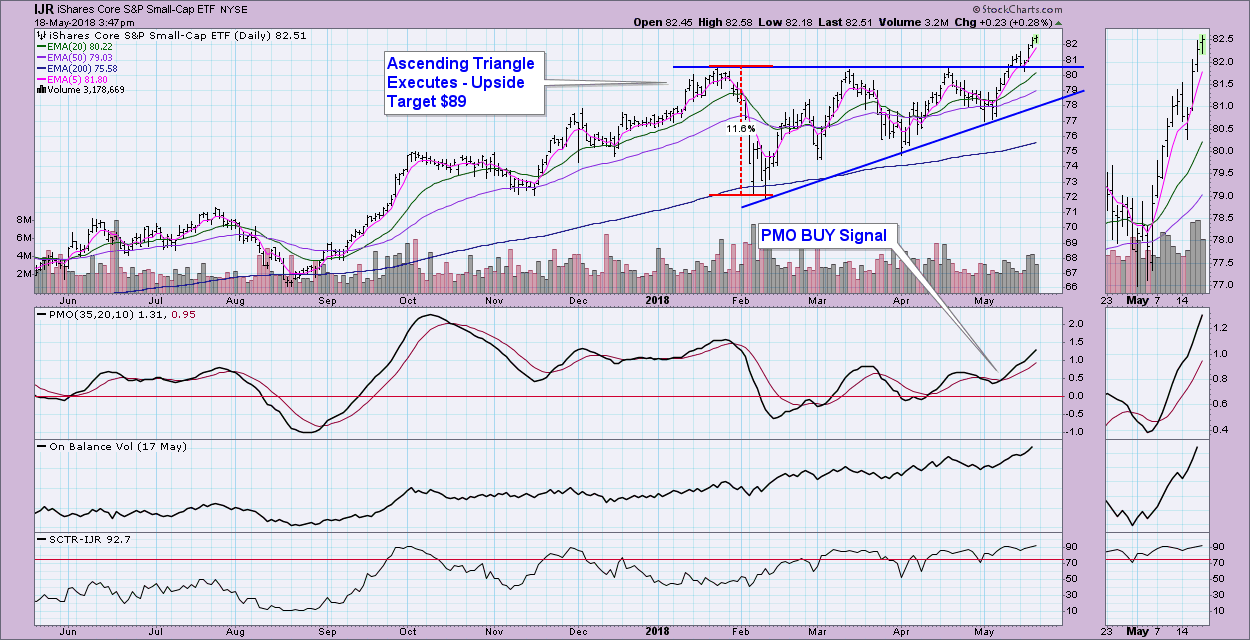
Small-cap stocks and indexes are quite healthy, far more than the large-cap indexes which are lagging behind... Read More
ChartWatchers May 05, 2018 at 03:03 PM
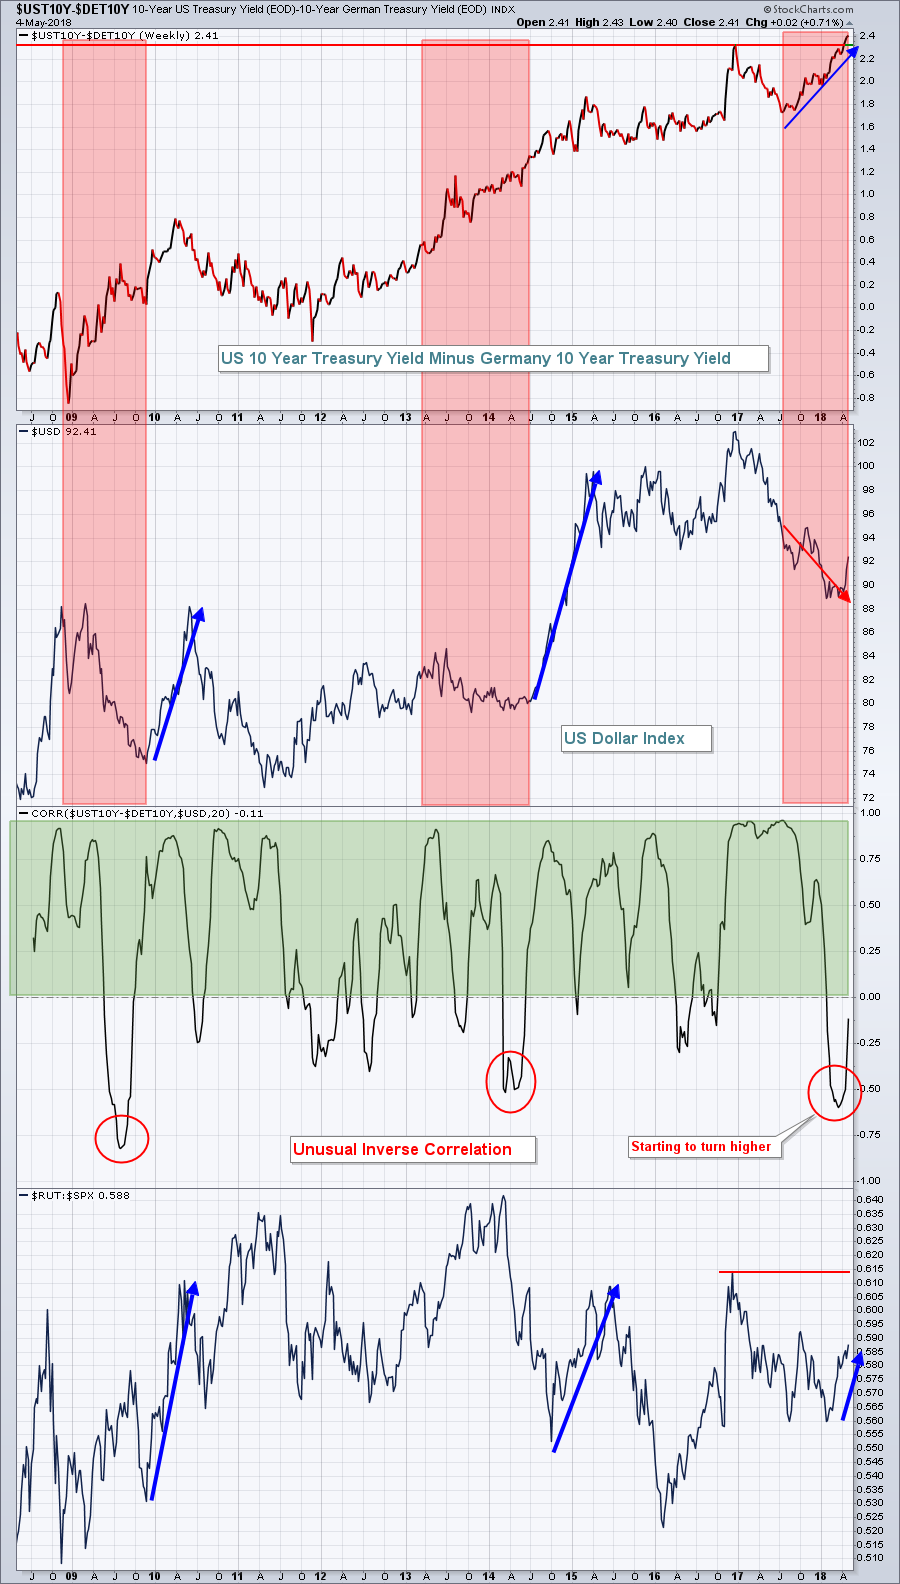
Throughout 2017 the U.S. Dollar Index ($USD) was falling and aiding profits on multinational companies found on the S&P 500. But it was time for the dollar to rise, as evidenced by a surging U.S. 10 year treasury yield ($UST10Y) vs. Germany's 10 year treasury yield ($DET10Y)... Read More
ChartWatchers May 05, 2018 at 02:27 PM
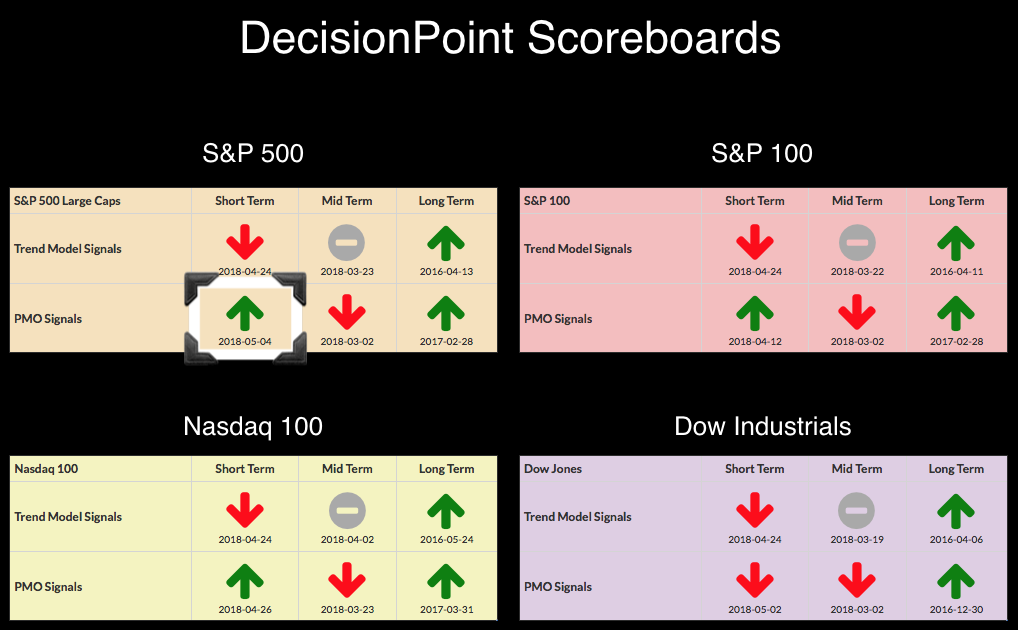
The SPX whipsawed into a Price Momentum Oscillator (PMO) BUY signal, suggesting a short-term rally is up next. Climactic breadth indicators popped on Friday and the VIX penetrated the upper Bollinger Band... Read More
ChartWatchers May 05, 2018 at 11:44 AM
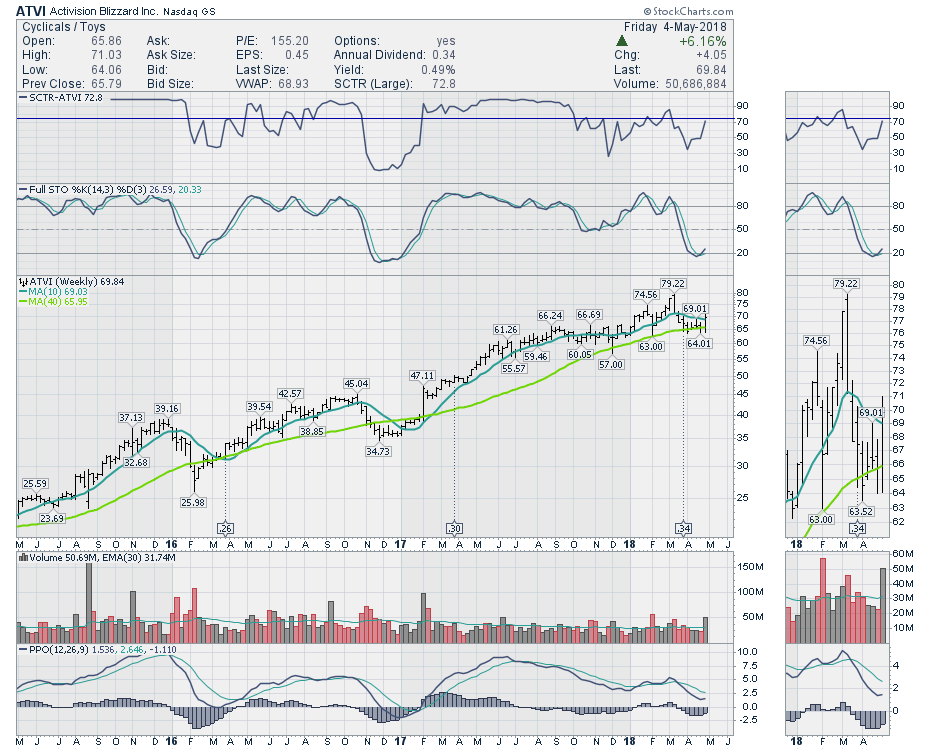
The toy business has been in a massive uptrend if you are in the right stocks. It is a fickle business group as they seem to treat the shares aggressively. Buy the good ones quickly, sell the weak ones even faster... Read More
ChartWatchers May 05, 2018 at 03:09 AM

2018 has been a tough year for stocks with the S&P 500 SPDR (SPY) basically unchanged (+.08%) for the year. During this journey to unchanged, SPY was up around 7% at its late January high and down around 5% at its February low... Read More
ChartWatchers May 04, 2018 at 10:38 PM
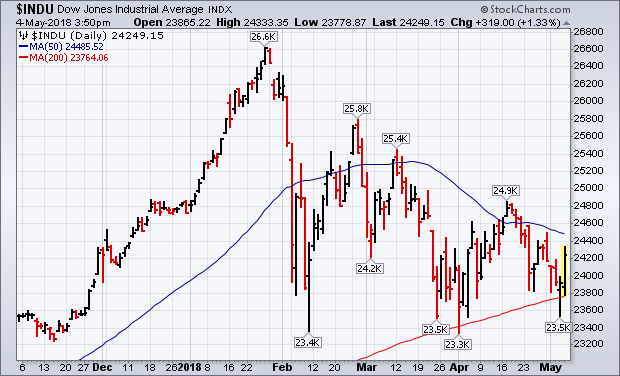
Editor's Note: This article was originally published in John Murphy's Market Message on Friday, May 4th at 3:50pm EST STOCKS REBOUND OFF 200-DAY LINES... Chart 1 shows the Dow surging more than 300 points after surviving another test of its 200-day average yesterday... Read More
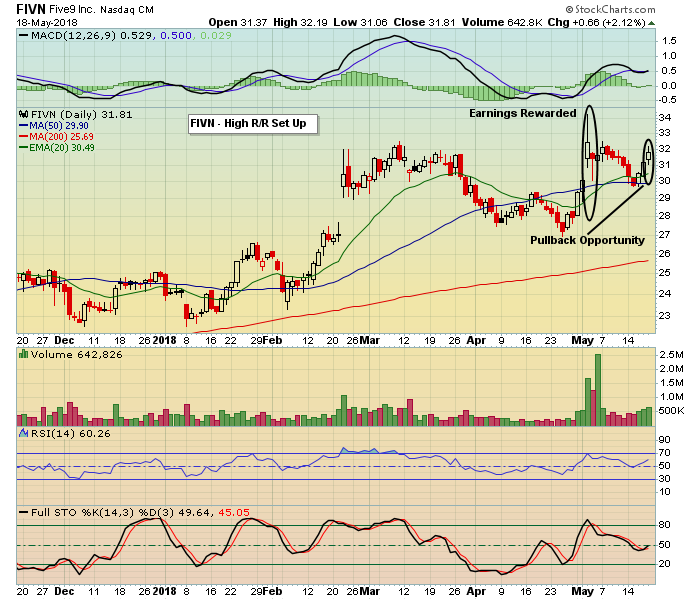
ChartWatchers May 04, 2018 at 10:29 PM
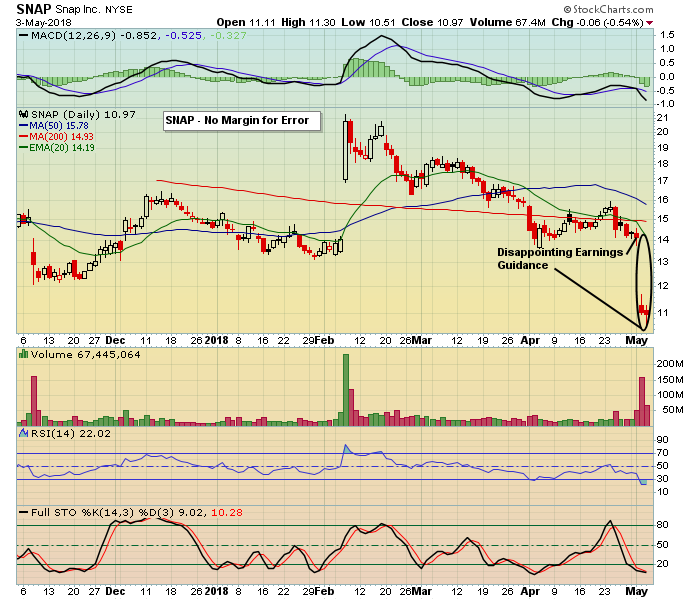
Analysts will tell you that this earnings season has been a great success. In fact, many companies exceeded earnings expectations and were handsomely rewarded by the market... Read More