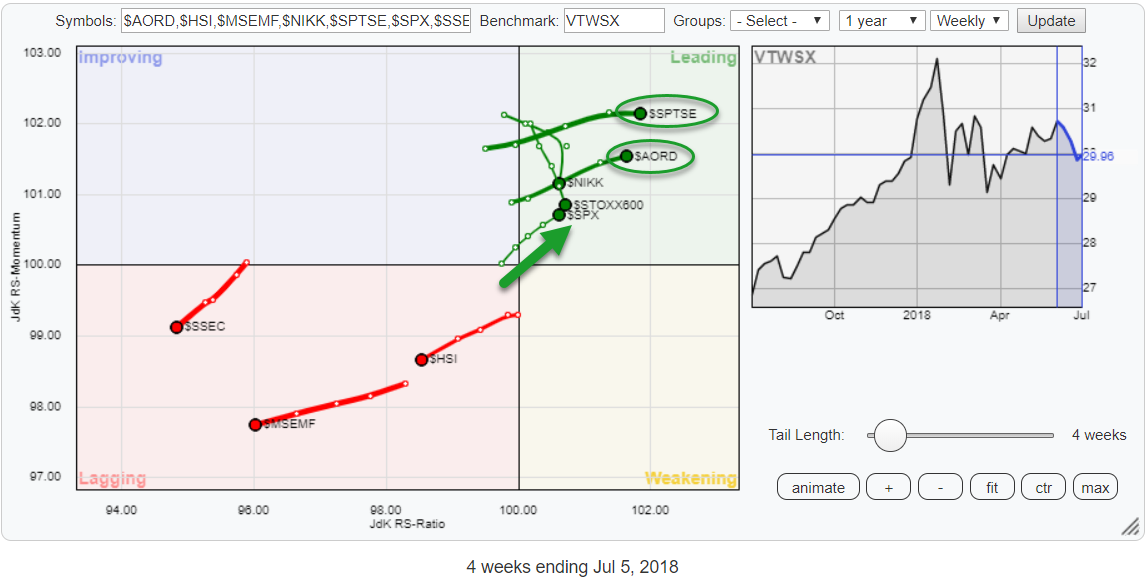
On the Relative Rotation Graph above I have grouped a selection of world equity market indices, mainly some big regions, and put them against the Vanguard Total World Stock Index (VTWSX) as the benchmark.
What immediately grabs our attention, or at least mine is the fact that this selection is clearly split between positive (Leading) and negative (Lagging).
The universe
The universe on the RRG is found in the table below
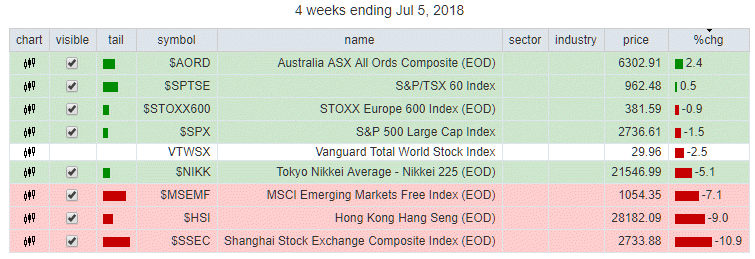 I have collected a number of ticker symbols for important international equity markets. Regional indices for Europe ($STOXX600) and Emerging Markets ($MSEMF) and some major equity markets around the world; USA ($SPX), Canada ($SPTSE), Japan ($NIKK), China ($SSEC), Hong Kong ($HSI) and Australia ($AORD).
The three markets inside the lagging quadrant are in a very clear relative downtrend. They are all at a heading between 180-270 degrees, so falling on both axes.
The difference is that $MSEMF and $HSI came into the lagging quadrant after a positive rotation through leading and improving earlier in the year while $SSEC dropped back into the lagging quadrant after a shoer stint through improving.
In the leading quadrant Japan ($NIKK) and Europe ($STOXX600) are losing relative momentum. Both markets came into the leading quadrant at relative high RS-Momentum values (> 102) but quite rapidly after crossing over to leading started to lose that momentum. This made them lose their positive RRG heading for the time being.
The other three markets, on the other hand, are all pushing deeper into the leading quadrant. The S&P 500 rotated back into leading after a short rotation close to the benchmark.
$SPTSE and $AORD came in from a bigger rotation through improving and are now leading in this universe. Especially the Australian stock market $AORD is showing an interesting chart.
Australia ASX All Ords Composite Index - $AORD
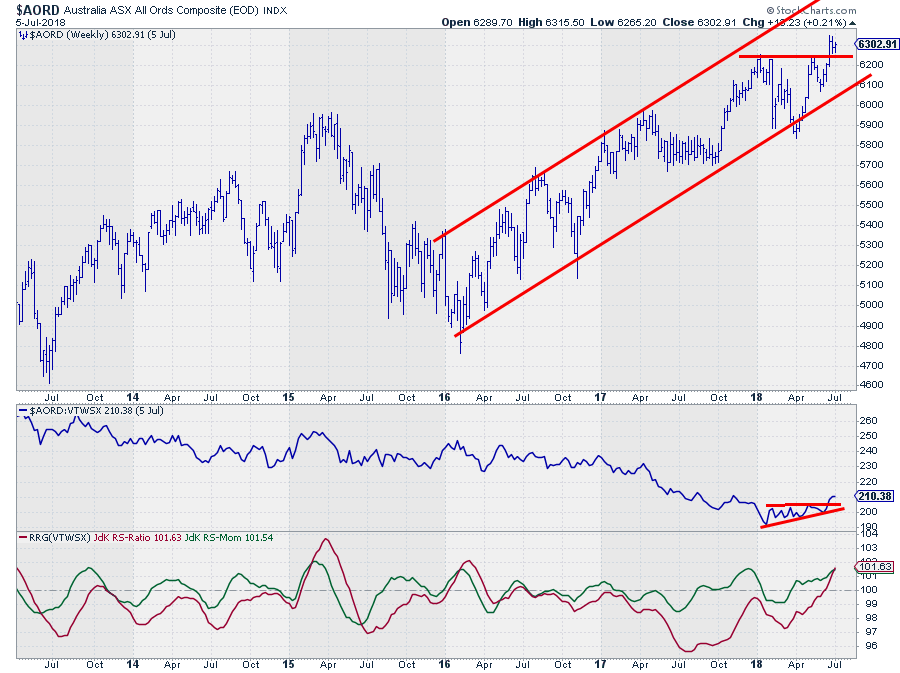 The $AORD index started a series of higher highs and higher lows out of the low that was set in early 2016. That rhythm is still intact and has just been confirmed again with the break to new highs above the resistance area around 6240.
This break confirmed the uptrend in price and opened up the way for a new leg higher targeting the upper boundary of the channel. With the former resistance around 6240 and the rising trendline coming in around 6100 as support levels, the downside is well protected.
From a relative perspective, Australia has underperformed the world index since the start of 2017 (while the price went up, so a good example of how rs can fall despite s rising price). Since the start of this year, a small ascending triangle had formed and completed last week with a break above the horizontal resistance at the top of that triangle.
This push in relative strength is now confirming the strength that is seen in the RRG-Lines for a while already.
Within this group of worldwide stock markets, Australia is showing a very attractive technical picture with the odds in favor of a further rise in both price and relative terms.
Let me know what you think of this usage of RRG in the comments? If you want to receive a notification when a new article in the RRG blog is published? Simply "Subscribe" and leave your E-mail address.
Julius de Kempenaer | RRG Research
RRG, Relative Rotation Graphs, JdK RS-Ratio, and JdK RS-Momentum are registered TradeMarks ®; of RRG Research
Follow RRG Research on social media:
If you want to discuss RRG with me on SCAN, please use my handle Julius_RRG so that I will get a notification.
