We just completed our second week of The Final Bar, the new closing bell show on StockCharts TV. During our Friday mailbag segment, I was asked about how institutional investors think about relative strength.
To be honest, relative strength is of vital importance to institutions because, well, that is how one gets paid! The better your stocks do on a relative basis, the better you do professionally. Or, as one of my analysts liked to put it, "Price is fine, but we eat the relative line."
But how does relative strength actually fit into the investment process? And how should individual investors think about relative strength relative to other tools in your arsenal?
Here are three ways you should be thinking about relative strength.
Relative Strength as a Scorecard
Quite simply, the relative strength line tells an institutional investor how well they are picking stocks. Are the charts of their holdings showing positive or negative relative strength? Which names are showing an inflection point in relative strength?
For individuals, the relative strength line tells you whether you're looking at the right chart in the first place.
A rising relative strength line means your stock is outperforming the broader equity space.
If you focus only on the absolute price returns, you may conduct excellent analysis and draw a valid conclusion of whether to buy a specific stock. But if the relative strength line is flat, you're basically doing no better than a passive investment product! Worse yet, if the relative strength is going down, then you may end up being correct on the price but underperform the broad market averages.
In general, you want to own stocks that are outperforming and not own stocks that are underperforming. Or, as Tom Bowley once put it, "You can't outperform by owning stocks that are underperforming."
Relative Strength as a Market Barometer
By tracking which stocks, industries and sectors are outperforming and which are underperforming, you can draw some valid conclusions about the overall market environment. Are traditional offensive or defensive sectors and groups outperforming? Is a long-time underperforming group starting to turn to a more positive relative strength profile? Answering these questions can help you look "under the hood" of the broad market averages to identify some of the themes that may or may not validate your analysis of the S&P 500 index.
One of my favorite relative strength measures is the performance of semiconductor stocks vs. the SPX. This group tends to outperform in bullish market phases and underperform in bearish market phases.
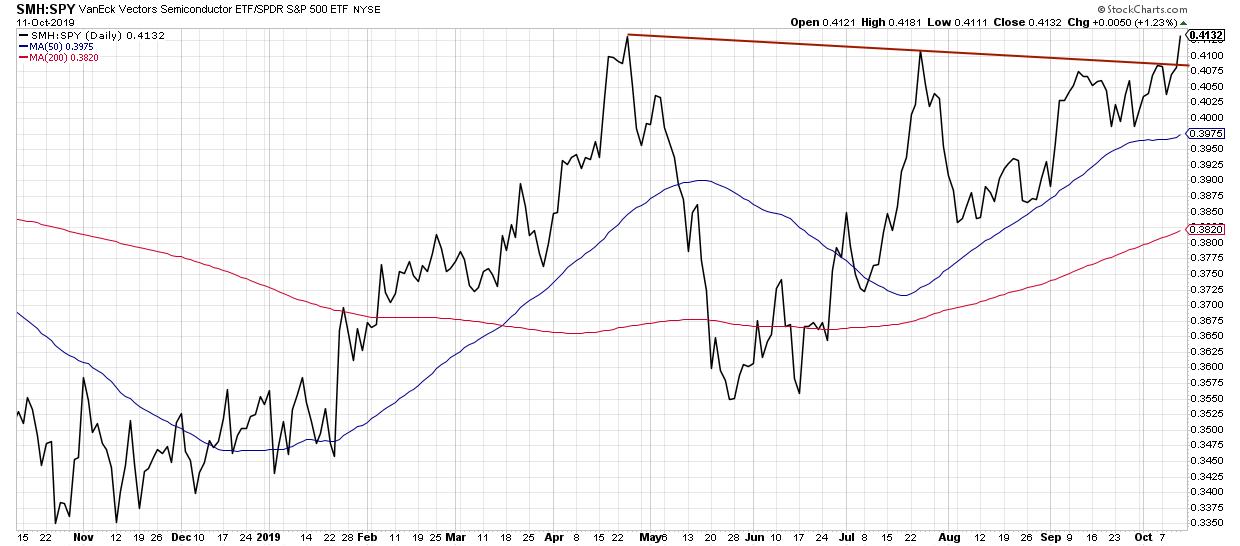
A relative breakout for semiconductors usually means bullish market conditions.
This week, the semiconductor ETF broke to new relative highs, suggesting a more optimistic outlook for US equities. While this is just one data point among many, it certainly appears to be a check in the positive column for now.
Relative Strength as a Technical Indicator
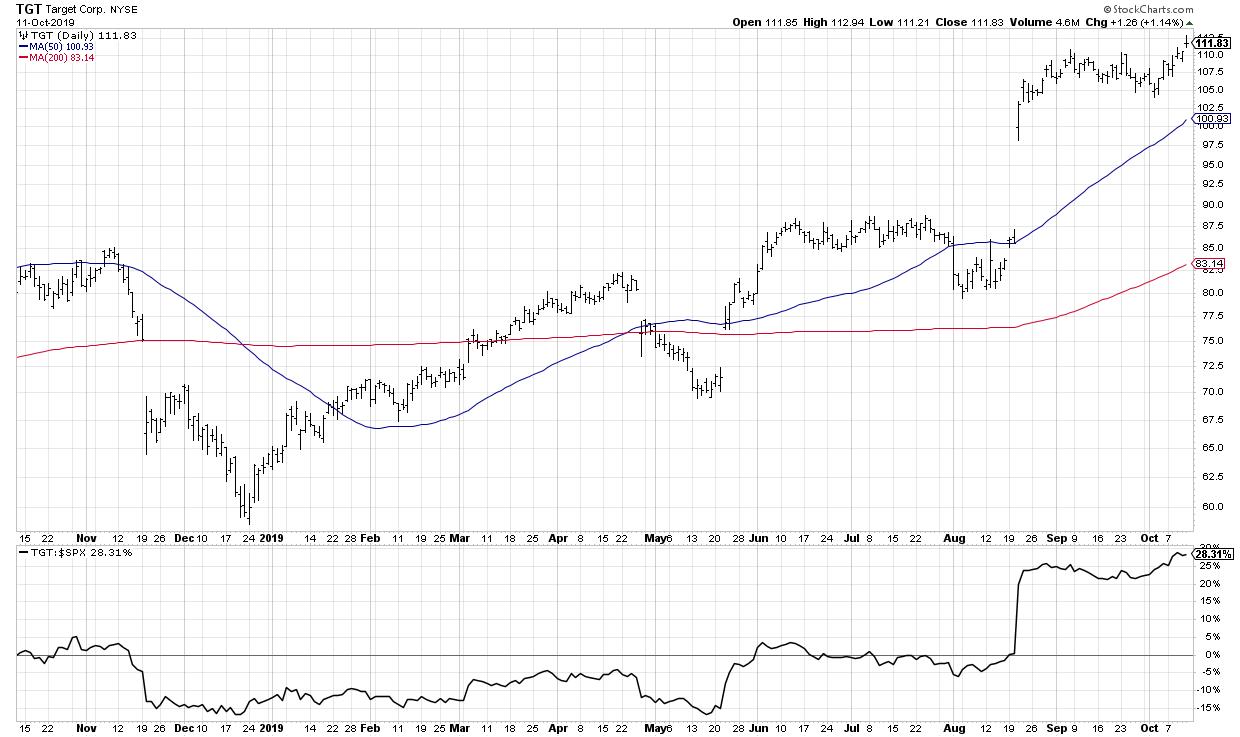
Finally, relative strength has value as a technical indicator. I like to look for stocks making new price and relative highs, which tend to jump off the page during my weekly review of the S&P 500 members.
I also routinely run a scan for stocks making new price highs, then look for confirmation on the relative strength line. Are new highs in price supported by a break to new relative highs? This suggests that institutions are getting behind the rally and reallocating capital to those names.
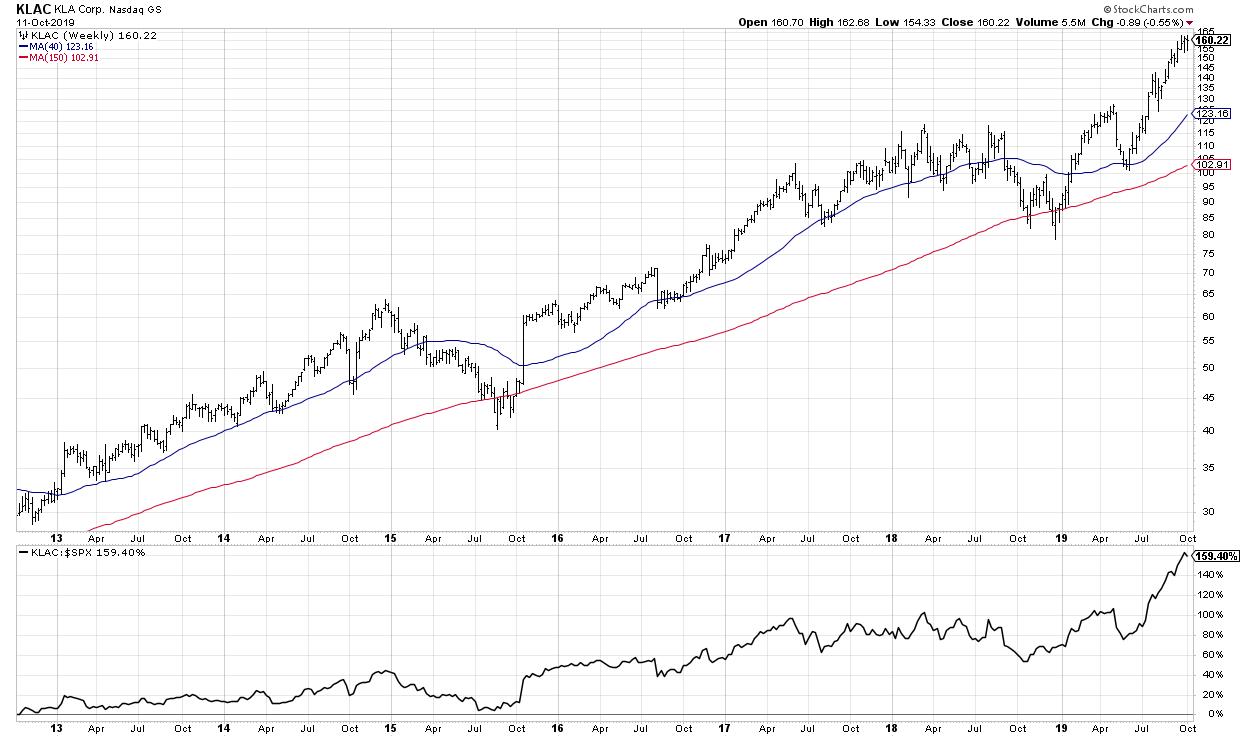
New price highs? Check. New relative highs? Check.
A friend of mine loved to compare portfolio management to managing a baseball team. Let's say you're setting the lineup for tonight's game. Would you start your players that are slumping and struggling, or would you start your best players to give yourself the best chance to win?
Why would you do anything different with your portfolio?
RR#6,
Dave
David Keller, CMT
Chief Market Strategist
StockCharts.com
David Keller, CMT is Chief Market Strategist at StockCharts.com, where he helps investors minimize behavioral biases through technical analysis. He is also President and Chief Strategist at Sierra Alpha Research LLC, a boutique investment research firm focused on managing risk through market awareness. He is a Past President of the Chartered Market Technician (CMT) Association and most recently served as a Subject Matter Expert for Behavioral Finance. David was formerly a Managing Director of Research at Fidelity Investments in Boston as well as a technical analysis specialist for Bloomberg in New York. You can follow his thinking at MarketMisbehavior.com, where he explores the relationship between behavioral psychology and the financial markets.
Disclaimer: This blog is for educational purposes only and should not be construed as financial advice. The ideas and strategies should never be used without first assessing your own personal and financial situation, or without consulting a financial professional.
The author does not have a position in mentioned securities at the time of publication. Any opinions expressed herein are solely those of the author and do not in any way represent the views or opinions of any other person or entity.
