On our November 20, 2019 DecisionPoint show on StockCharts TV, Carl and I introduced the new Golden Cross and Silver Cross Indexes. The Golden Cross Index measures the percentage of components in an index or sector that are on LT Trend Model BUY signals (50-EMA > 200-EMA). The Silver Cross Index, meanwhile, measures the percentage of components that are on IT Trend Model BUY signals (20-EMA > 50-EMA). By tracking these readings with a signal line, we can see a clear picture of participation within an index or sector.
Below is the list of Indexes and Sectors we track the GCI/SCI for.
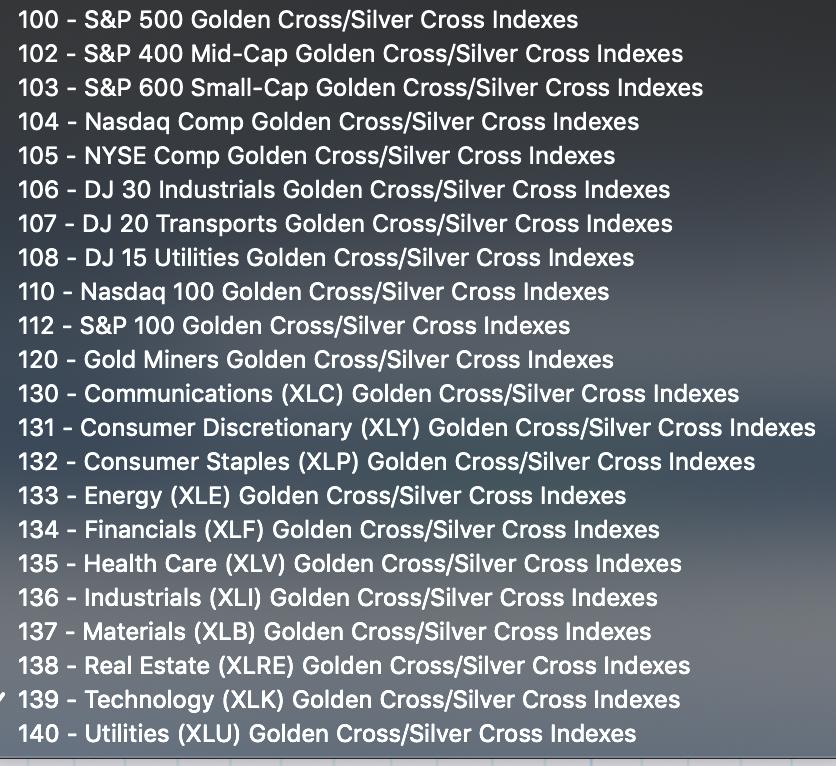
If you would like to add this list to your ChartLists, go to "My Account" and click "Manage ChartPacks". You'll want to download the free "DecisionPoint Market Indicators (DPMI)" ChartPack.
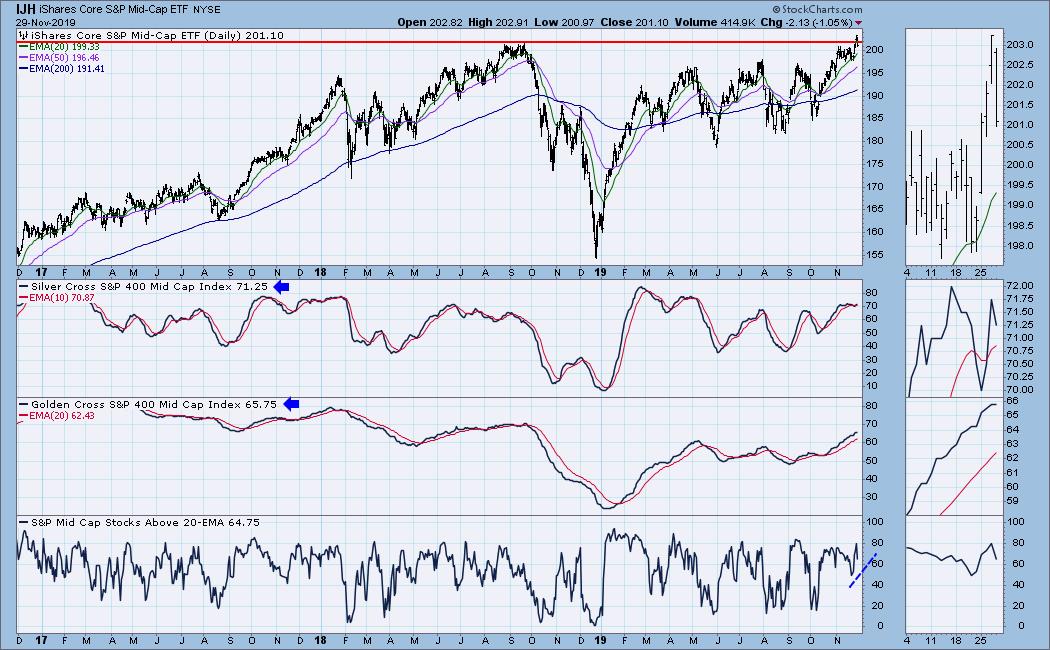
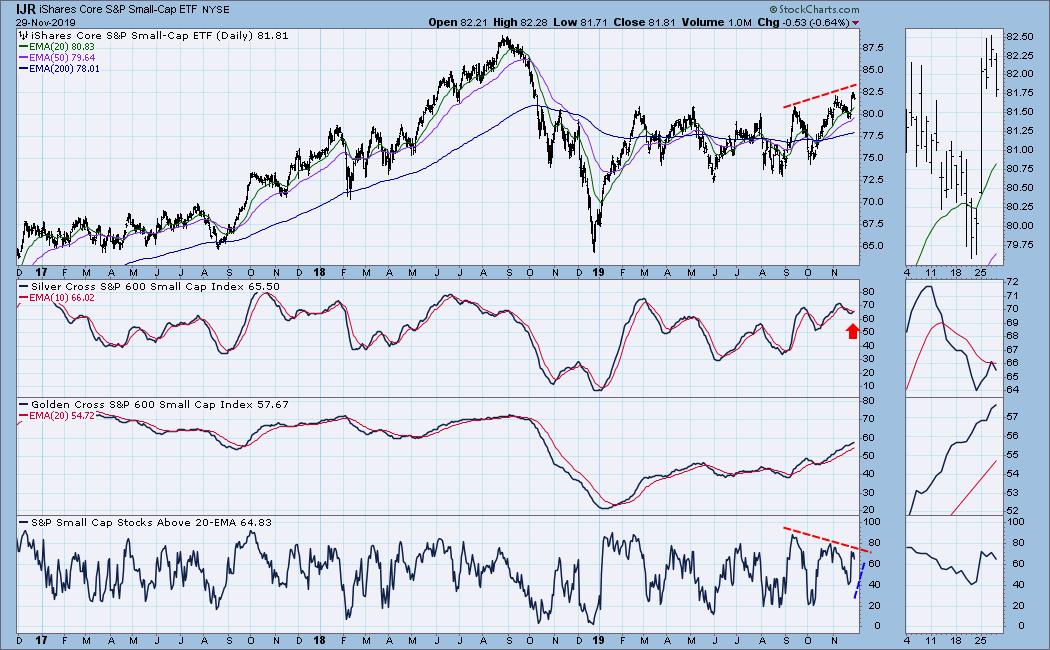
Below are a few indexes I've selected to talk about. You'll see that these, along with the % of stocks above their 20-EMA, can confirm a price move or give you warning that participation isn't what it should be. Below are the indicators for the SPX, S&P 400 (IJH) and S&P 600 (IJR).
We are now seeing confirmation by both GCI/SCI and % above 20-EMA is catching up. We can see nearly 3/4 of the components are participating in the IT and LT rally.
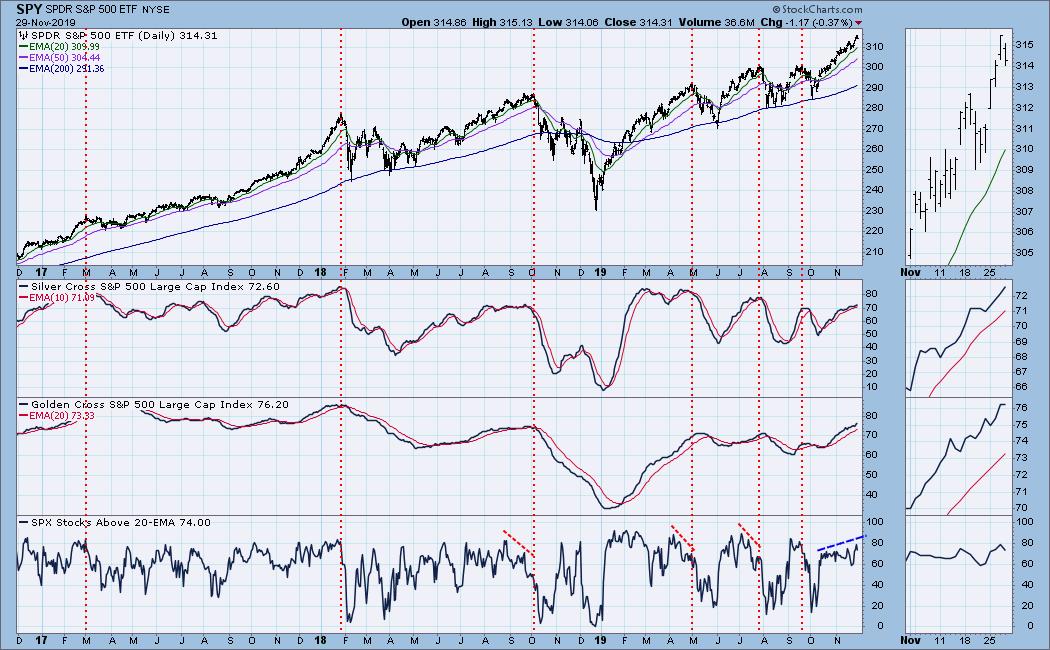
Both the GCI and SCI confirmed the breakout to new all-time highs as both reached readings higher than the previous top in September.
The struggle continues for the small-caps. While the situation is improving, participation is particularly low in comparison to the mid- and large-caps. I don't like the hesitation in SCI, nor the negative divergence with % of stocks above their 20-EMAs.
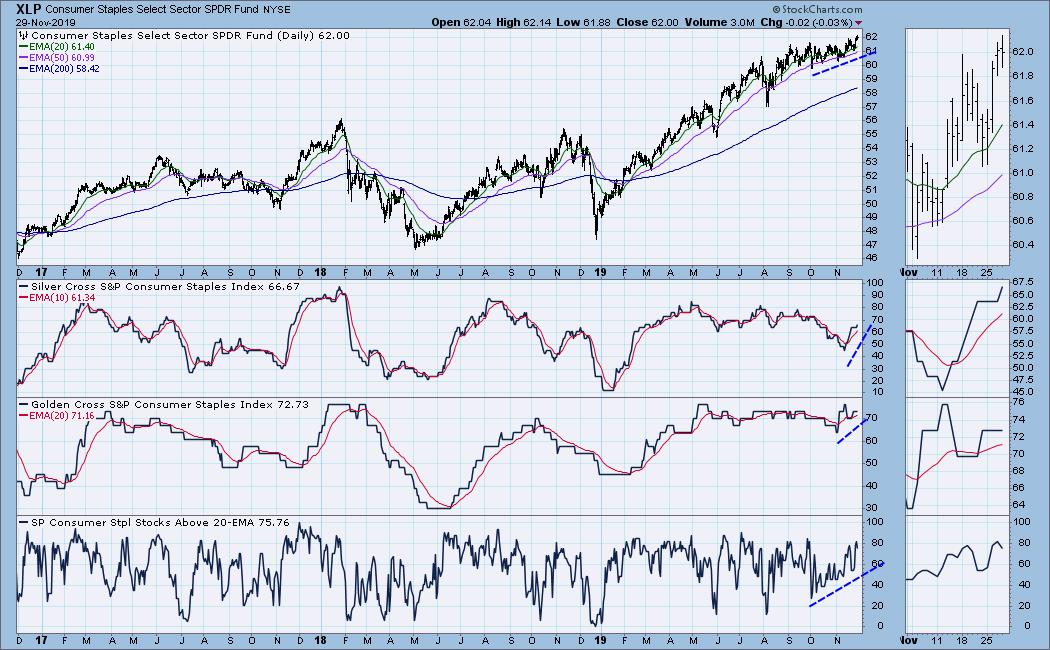
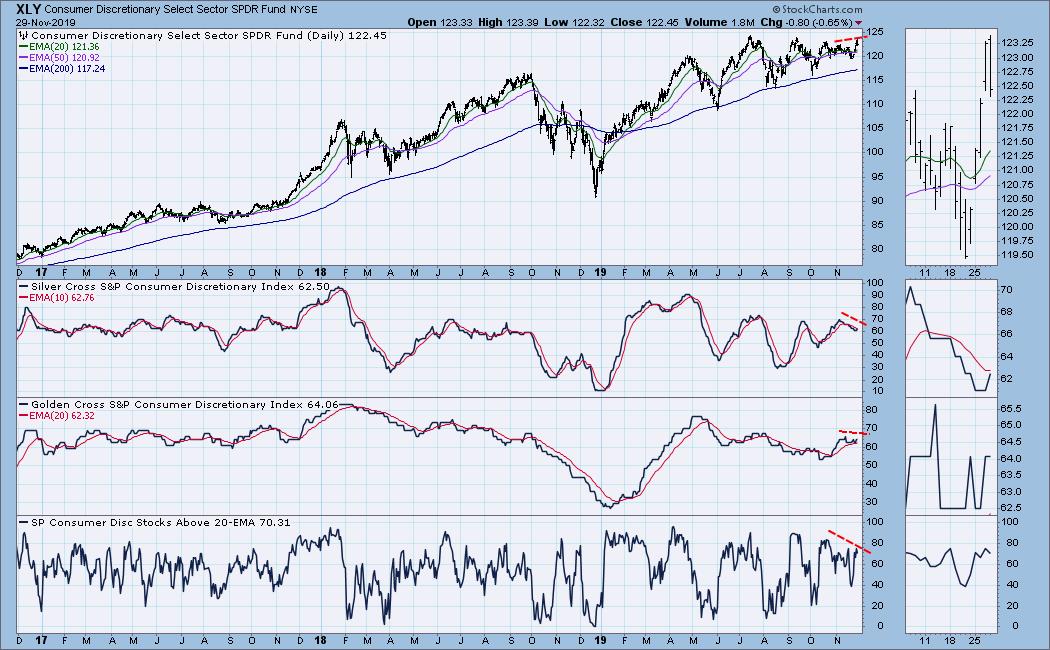
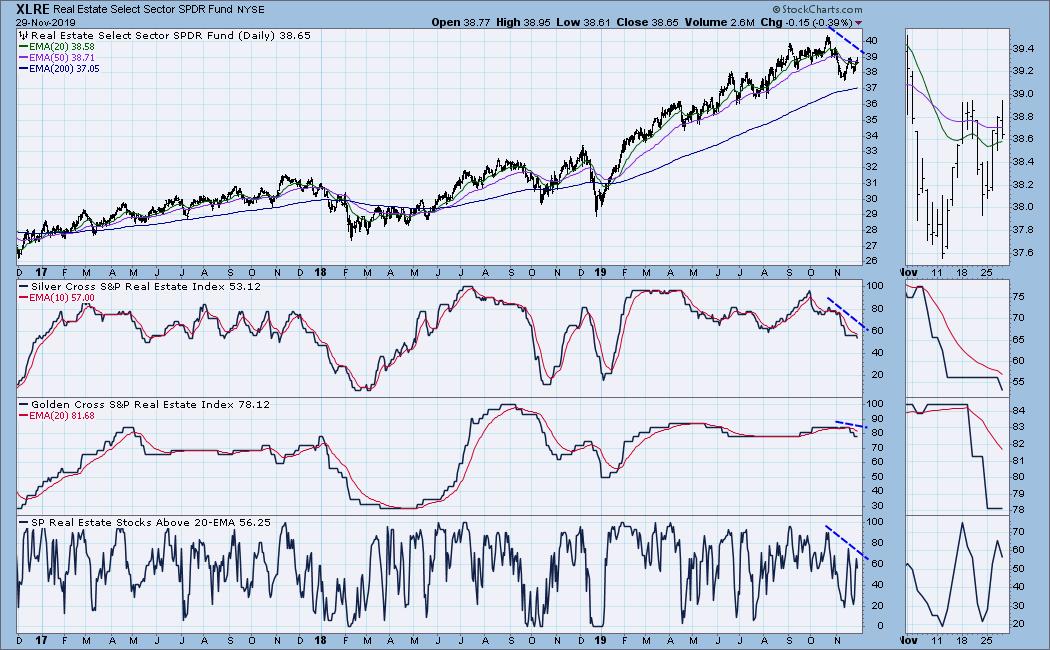
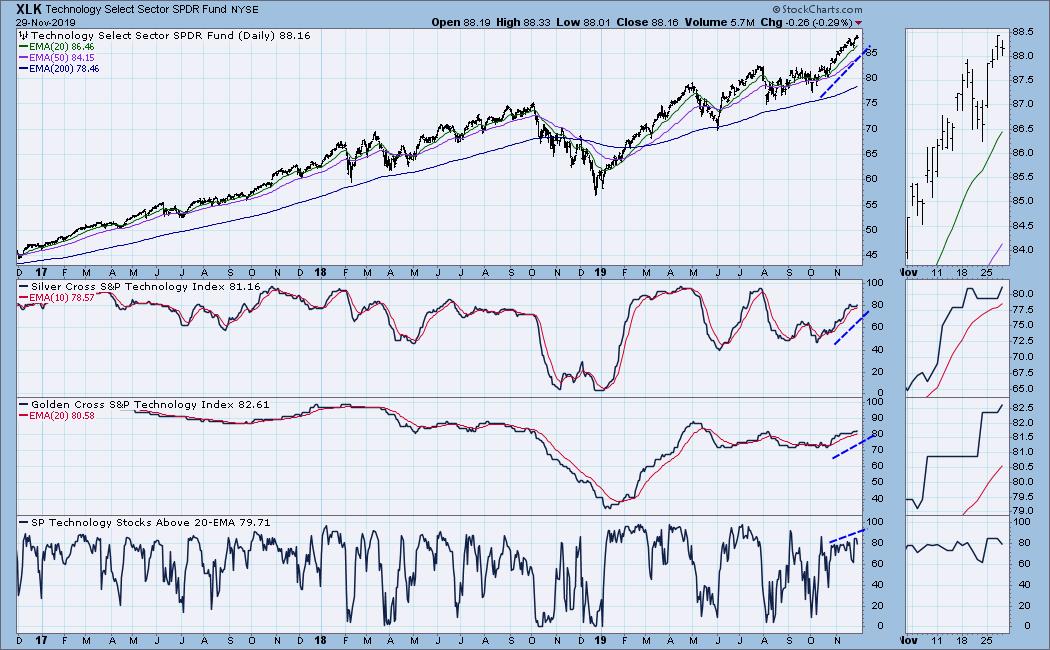
Below are a few of the sector charts. Note the annotations show you confirmations (blue) and negative divergences (red).
I hope you're as excited about the unveiling of these new indicators as we are!
Watch the latest episode of DecisionPoint with Carl & Erin Swenlin LIVE on Mondays at 5:00pm ET or on the StockCharts TV YouTube channel here!
Happy Charting! - Erin
Email: erinh@stockcharts.com
Do Not Miss Market Vision 2020 Online Conference!
I will be presenting at the "Market Vision 2020" online conference on January 4th! It is sponsored by EarningsBeats.com and promises to be "THE" event to start the new year. We will have many of the commentators that you love presenting their "market view" for 2020, with John Murphy as the keynote speaker! For information on the event, sign up for the free emails that will give you all the details as we get closer!

Erin Swenlin will be presenting at the The MoneyShow Las Vegas May 11-13, 2020! You'll have an opportunity to meet Erin and discuss the latest DecisionPoint news and Diamond Scans. The conference is free to attend or view online!
**Don't miss any of the DecisionPoint commentaries! Go to the "Notify Me" box toward the end of this blog page to be notified as soon as they are published.**
NOTE: The signal status reported herein is based upon mechanical trading model signals, specifically the DecisionPoint Trend Model. These define the implied bias of the price index based upon moving average relationships, but they do not necessarily call for a specific action. They are information flags that should prompt chart review. Further, they do not call for continuous buying or selling during the life of the signal. For example, a BUY signal will probably (but not necessarily) return the best results if action is taken soon after the signal is generated. Additional opportunities for buying may be found as price zigzags higher, but the trader must look for optimum entry points. Conversely, exit points to preserve gains (or minimize losses) may be evident before the model mechanically closes the signal.
Helpful DecisionPoint Links:
DecisionPoint Shared ChartList and DecisionPoint Chart Gallery
Price Momentum Oscillator (PMO)
Swenlin Trading Oscillators (STO-B and STO-V)
