TAKEAWAYS
- Dow Jones Industrial Average closes above 40,000 for the first time
- Commodities such as silver, copper, and gold are moving higher
- Volatility remains low, indicating investors are complacent

It made it! The Dow Jones Industrial Average ($INDU) closed above 40,000 for the first time, another record close for the index. What an exciting week!
And most of that excitement came in the last few minutes of the trading week. We'll take it. After a few weeks of lethargic activity in the stock market, the optimism is back.
Get the live chart.

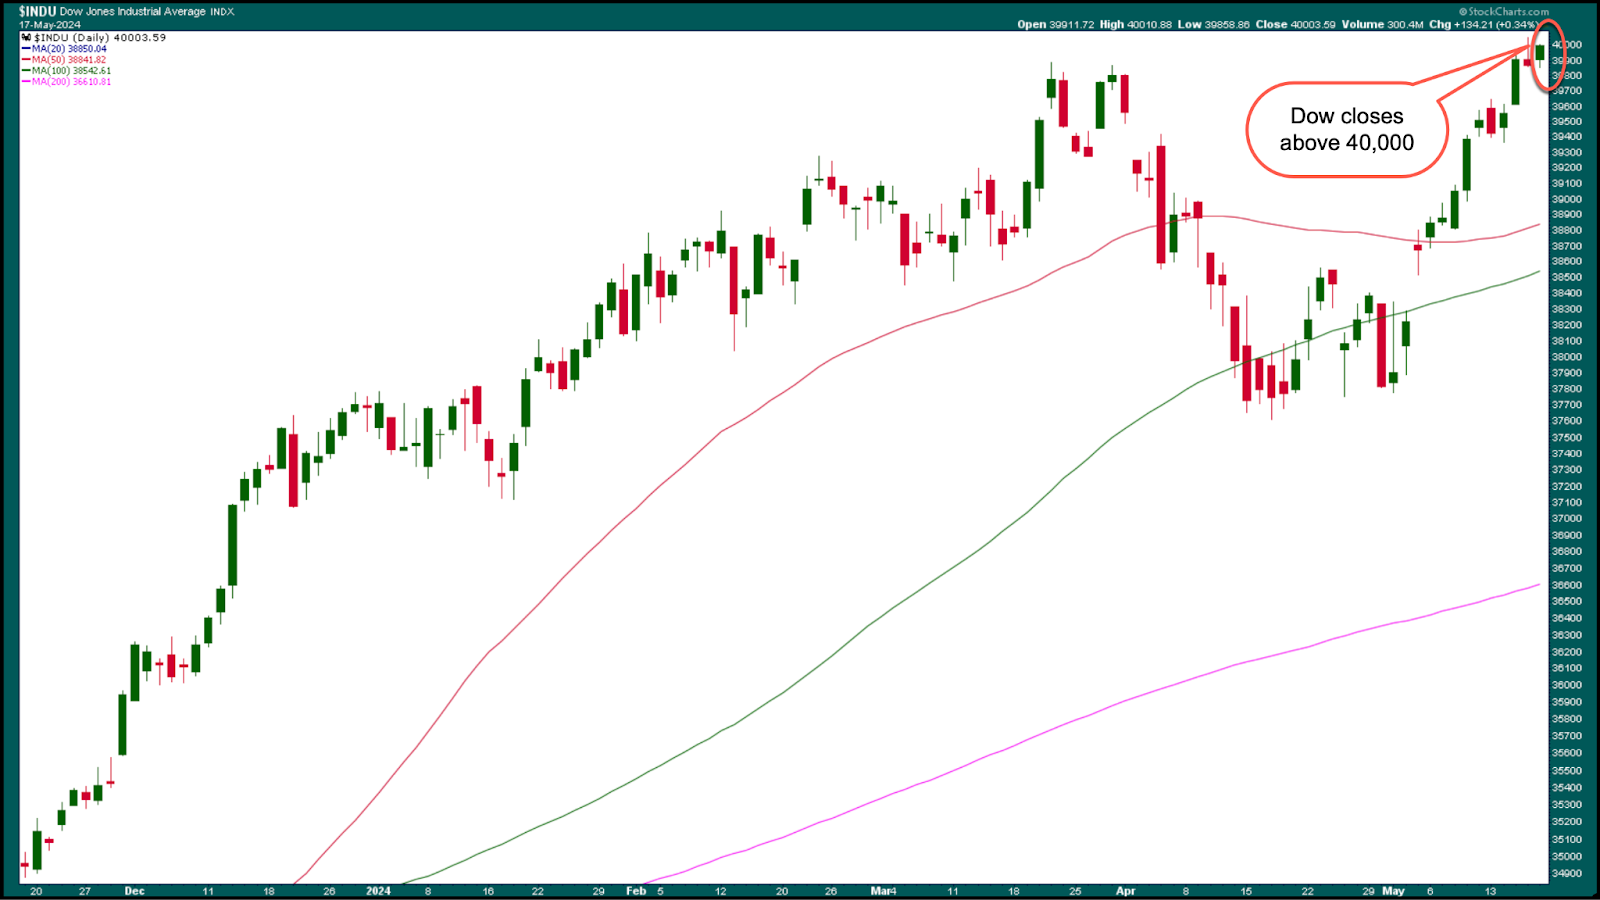
CHART 1. DOW JONES INDUSTRIAL AVERAGE CLOSES ABOVE 40,000. Investors will be looking for the upside momentum to continue next week.Chart source: StockCharts.com. For educational purposes.
A Recap of Stock Market Activity
The stock market regained its mojo on Wednesday, when inflation data came in cooler than expected. It then took a bit of a breather on Thursday and, for the most part, on Friday, but the last few minutes of the trading day did reinject some optimism, which is unusual for end-of-week trading. The stock market got what it wanted, reacted, and then decided to get a head start on the weekend.
Next week, investors will be focused on looking for upside follow-through. Now that interest rate hikes are off the table and it looks like cuts will happen sometime this year, investors have renewed their confidence in the stock market.
Get the live chart here.

The CBOE Volatility Index ($VIX) continues to be low, further confirming that investors are complacent. $VIX is close to its December 2023 lows, when investors' confidence in equities reignited following the October 2023 lows.
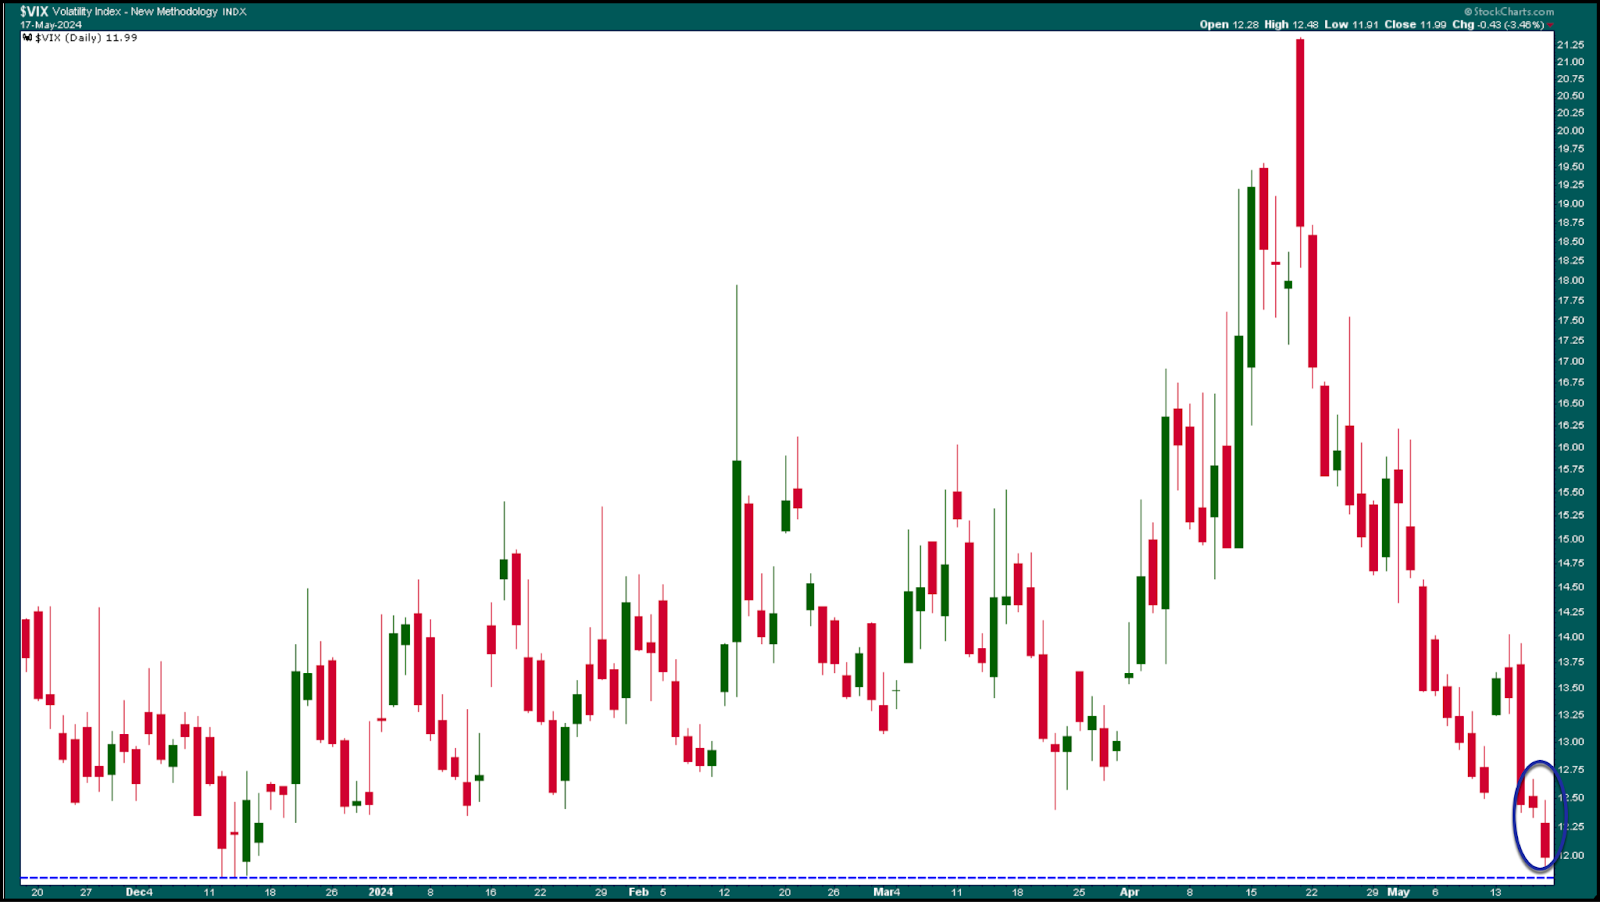
CHART 2. DAILY CHART OF THE VIX. The VIX is close to its December lows, coinciding with the time investors renewed their confidence after the pullback in October.Chart source: StockCharts.com. For educational purposes.
While equities have trended toward the upside, commodities have also broken out. The daily chart of the Invesco DB Commodity Tracking Index Fund (DBC) shows the index has broken out above a downward trending channel, suggesting that the pullback in commodities may be behind us.
Follow the live chart.

Commodities are inflation-sensitive, and, given that inflation may be cooling, commodities may be breaking out of the flag pattern you see in the chart below.
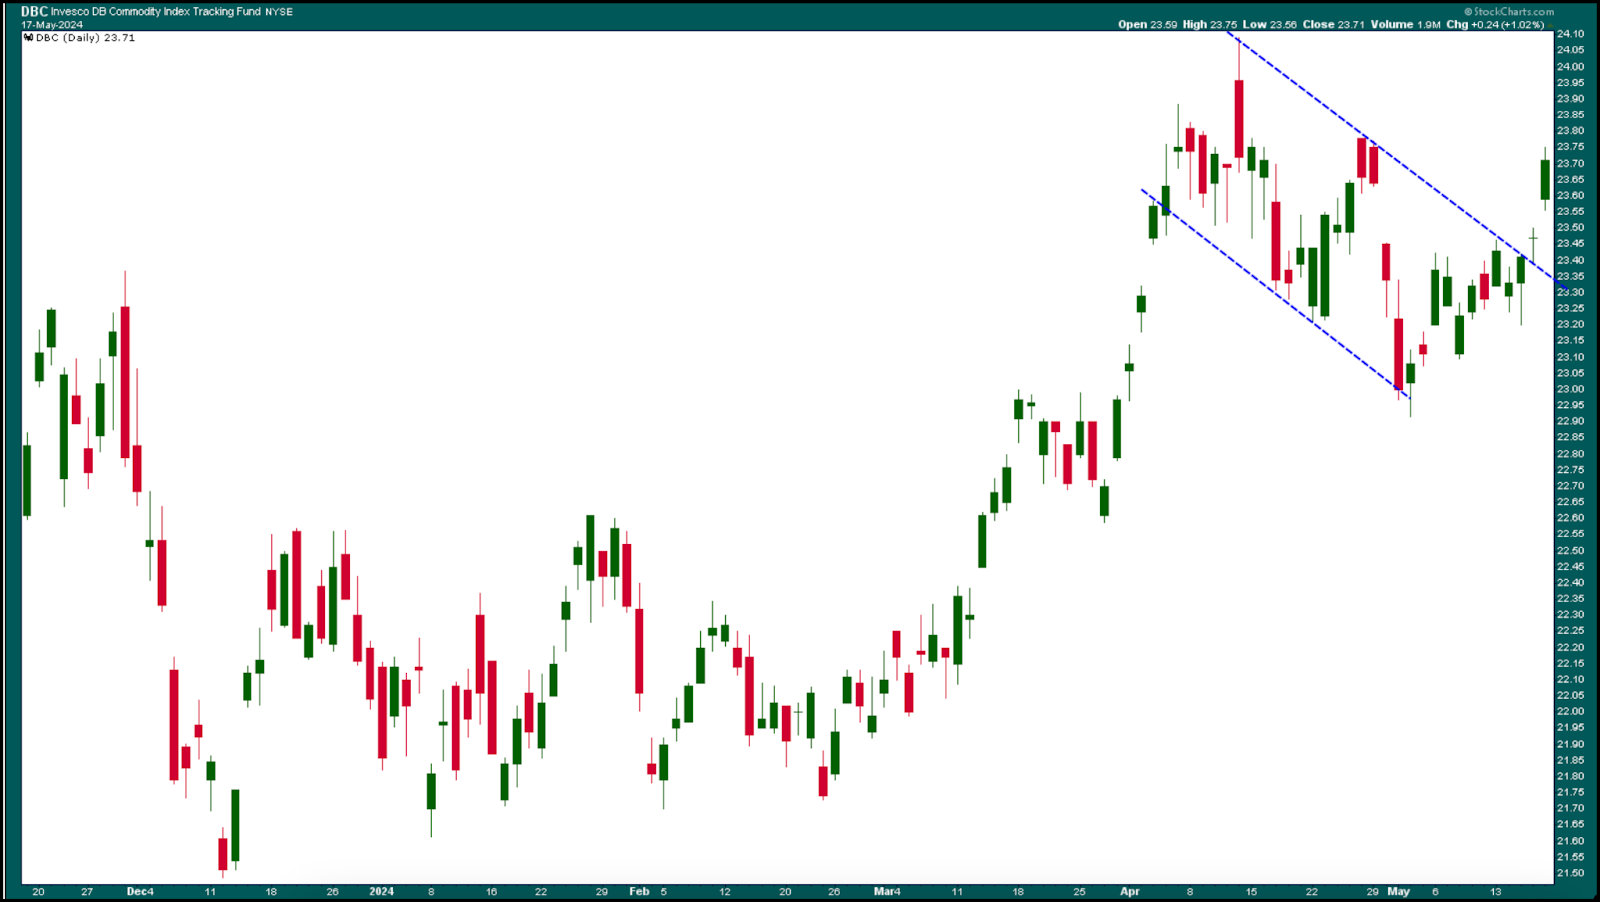
CHART 3. COMMODITIES BREAKING OUT. Commodities are also showing strength as they break out from a flag pattern.Chart source: StockCharts.com. For educational purposes.
Get your live chart here.

Copper and silver prices soared on Friday, and gold looks like it's on its way to revisit its all-time highs. Silver saw a significant breakout on Friday. It's worth looking at the chart of iShares Silver Trust ETF (SLV) to get a sense of the breakout magnitude.
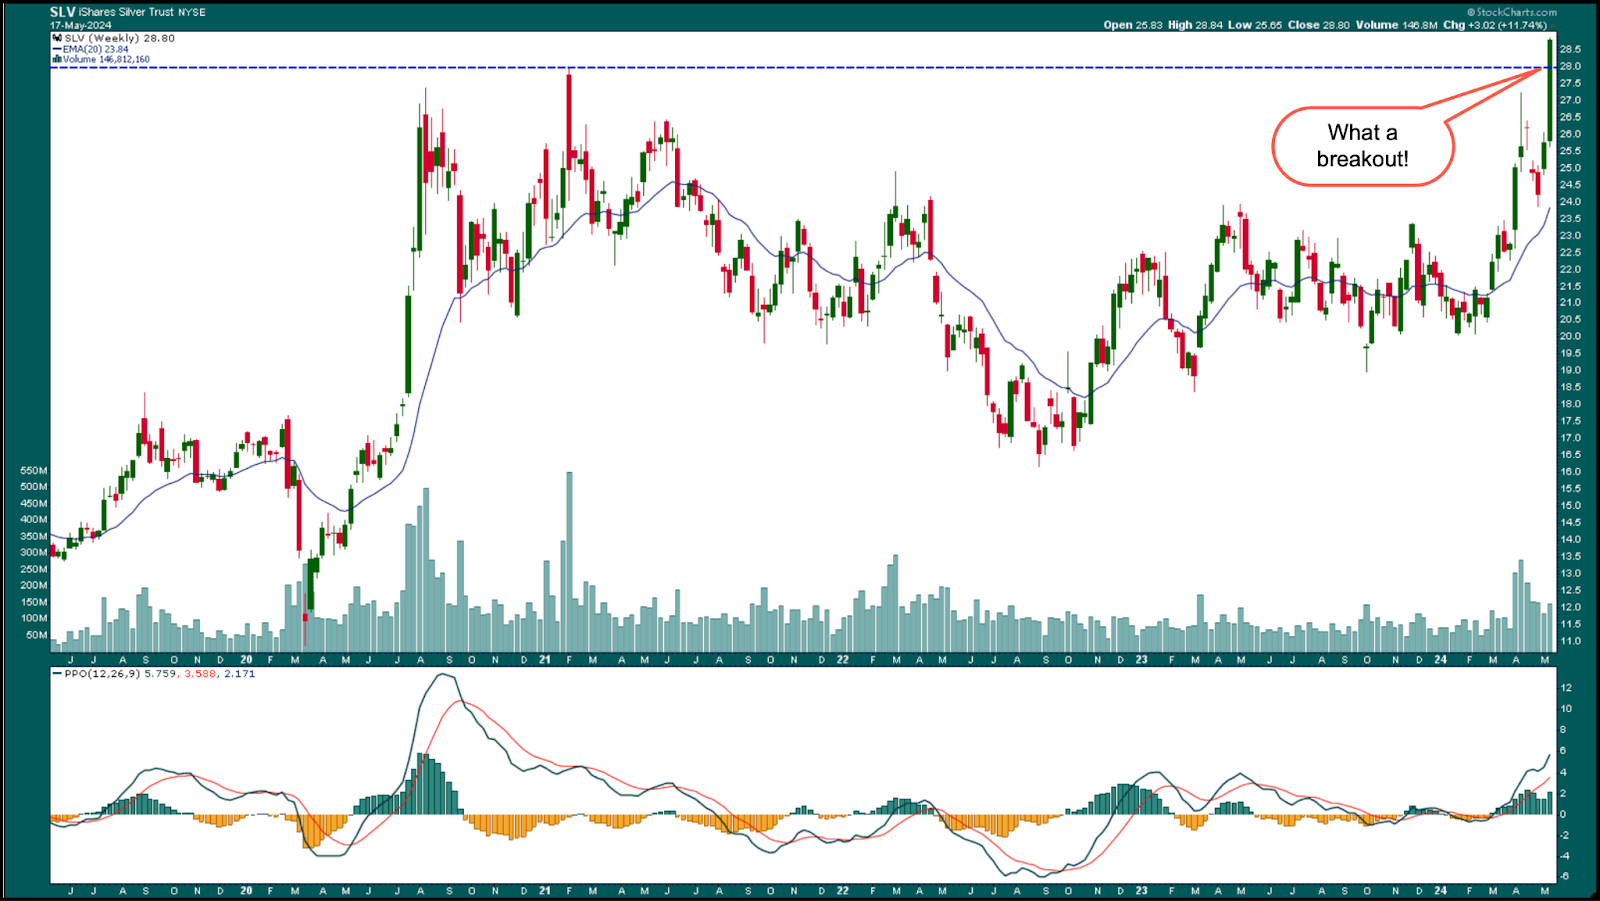
CHART 4. SILVER SEES SIGNIFICANT BREAKOUT. The iShares Silver Trust ETF (SLV) has broken above its 2021 high. How much higher can it go? The next resistance is at around $35.Chart source: StockCharts.com. For educational purposes.
SLV has broken out above its February 2021 high. The price action on Friday suggests that price will continue higher next week. The next resistance level could be the 2012 highs, which is around $35, so there's room for upside movement in SLV. If you want to get in on the silver rally, opening a position in SLV may be something to consider. However, be sure to identify your stop losses before entering a trade. Although SLV seems poised to move higher, anything can reverse the move. Make sure you're comfortable with the risk/reward ratios.
SLV is well above its 20-week exponential moving average, and the Percentage Price Oscillator (PPO) shows that momentum is rising. If the trend continues, then SLV could see a strong rally. It's been a while since silver got some love.
And There's NVIDIA
Next week should be interesting. The highlight is NVIDIA's earnings—the company reports on Wednesday after the close. Analysts estimate earnings to come in at $5.57 and revenues at $24.57 billion. If NVIDIA (NVDA) beats, it could be a big catalyst for the markets to move higher. But the worry would be if NVDA misses expectations. A downside move would be of a much greater magnitude than an upside move. NVDA has had a significant impact on the stock market's performance, so just about every investor will be tuned in to the news after the close on Wednesday.
End-of-Week Wrap-Up

- S&P 500 closes up 0.12% at 5,303.27, Dow Jones Industrial Average up 0.34% at 40,003.59; Nasdaq Composite down 0.07% at 16,685.97
- $VIX down 3.46% at 11.99
- Best performing sector for the week: Technology
- Worst performing sector for the week: Industrials
- Top 5 Large Cap SCTR stocks: MicroStrategy Inc. (MSTR); Vistra Energy Corp. (VST); Super Micro Computer, Inc. (SMCI); Robinhood Markets (HOOD); Vertiv Holdings (VRT)
On the Radar Next Week
- Earnings from Nvidia (NVDA)
- Fed speeches
- April Existing Home Sales
- New Home Sales
- May Michigan Consumer Sentiment
Disclaimer: This blog is for educational purposes only and should not be construed as financial advice. The ideas and strategies should never be used without first assessing your own personal and financial situation, or without consulting a financial professional.
Happy charting!
