Quite frankly, how could we ever keep up with all the moving parts in this market without charts? Sometimes a chart jumps out at you and really makes you think about the implications depending on the outcome. This week shocked a few followers with a macro view into commodities.
This is the monthly chart of the Commodities Research Bureau data ($CRB). In August we registered the lowest reading in 13 years but it doesn't seem to be drawing much chatter across the trading communities. It was also the 3rd lowest reading in 40 years and we were only 3.3 points from breaking to the lowest low. The question to be asked is what happens if we break down significantly? I discuss the chart in the webinar. Click here to go to the webinar link. 20150910 Commodities Countdown
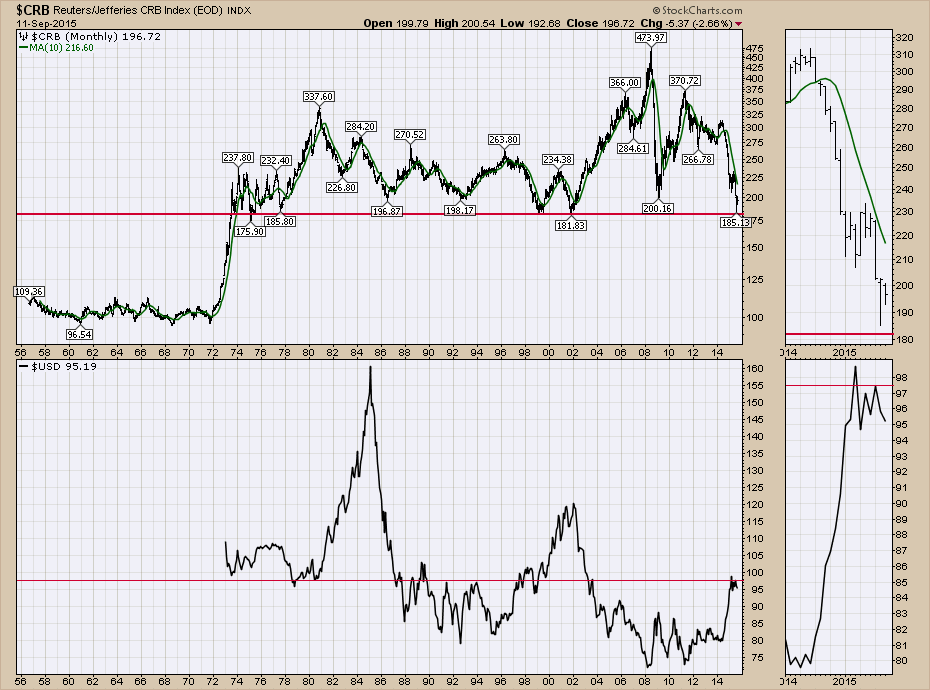
In 2002, the commodities marked the lowest point in 25 years. It turned out to be the best buying opportunity possible. A significant part of the reason was the US Dollar topped out and commodities went on an amazing run.
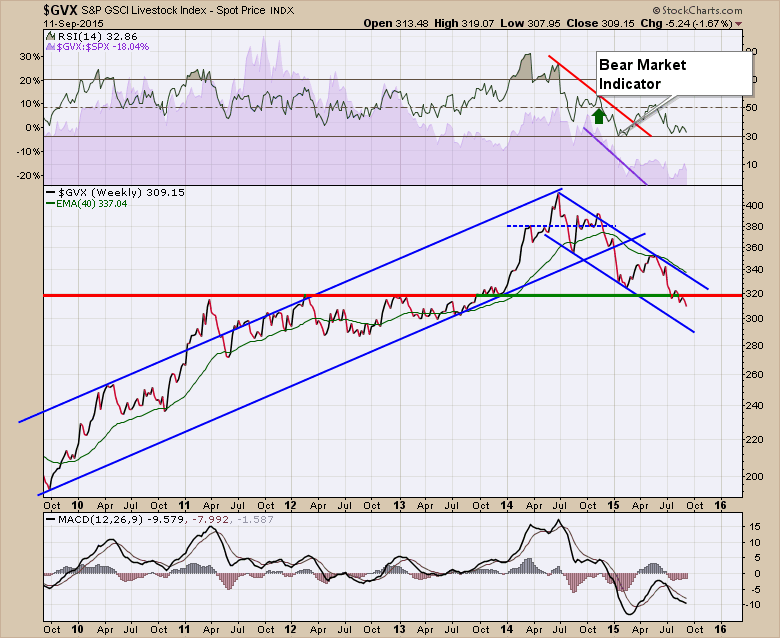
None of the 5 Goldman Sachs Commodities Indexes are bullish, but the newest support resistance breakdown showed up in Livestock recently. More on this in the webinar. 20150910
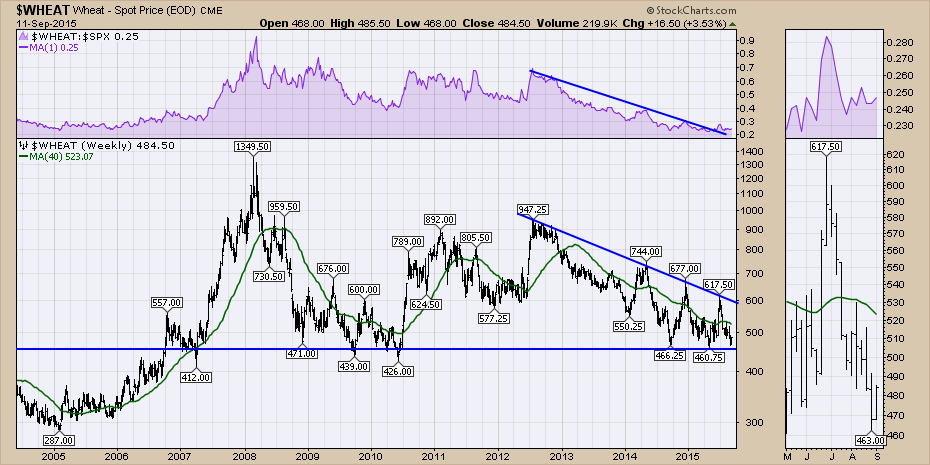
Wheat is also close to a major breakdown. Traders can shoot against the $460 level. The tracking ETF for Wheat is WEAT.
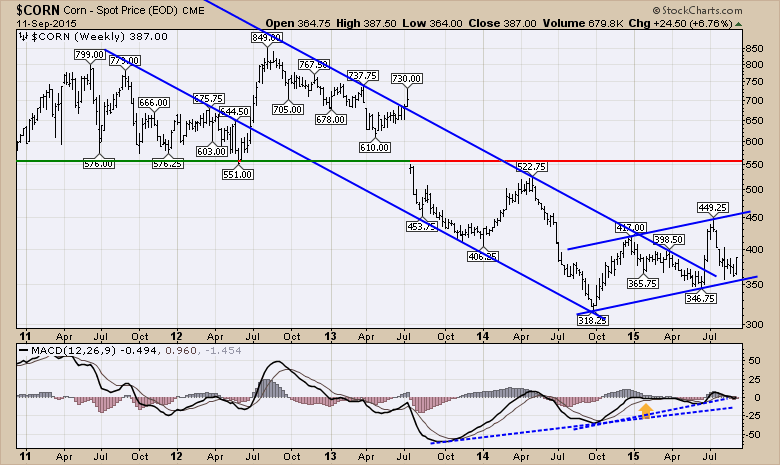
Corn is trying to bounce off an up trending support line and the continuation point of the down trend line. We have been monitoring this for a few months now. CORN is the tracking ETF.
More on the directional opportunities in Coffee on the webinar. Commodities Countdown 20150910
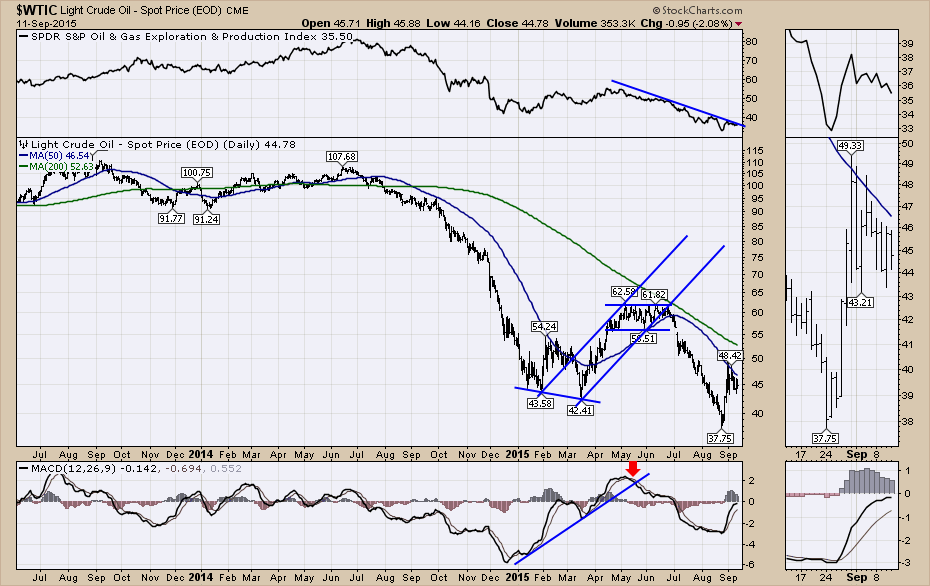
I discussed how important some of the moving averages are on Crude Oil. Here is the chart.
There is a lot more on the webinar. Commodities Countdown 20150910. Post your thoughts below on the 40 year commodity chart or anything else in Commodityville. Let me know what you saw that interested you or would like to see in the webinars. Feel free to comment directly about the charts in this article. As we start up this commodity series I think it is important that you share what you would like to spend more time on.
I'll be covering off the Canadian market on Tuesday at 5:00 PM EDT. When I cover that, we usually end up drifting into some of the commodities as well. Tuesday's Canadian Technician Webinar.
For more in depth commodities coverage, join me next week on the Commodities Countdown Thursday at 5 PM EDT. Thursday's Commodities Countdown Webinar.
Good trading,
Greg Schnell, CMT
