- Bullish Percent Indexes are at strong buy levels
- Crude unchanged
- Natural Gas gets set for April
- Dollar spins back to the top of the 11 week range
- Currencies are vulnerable to major trend changes now
- Global Indexes give monthly sell signals
The five Bullish Percent indexes in the videos give some great clues.
With a wild ride this week, investors are trying to solve the riddle of when the lows are in. In this weeks video, I cover off a couple of clues why this is probably a very successful entry point with close stops. One example is the Bullish Percent Indexes. The $BPNDX is at a very tempting buy level as the 30 level is really good. It is also particularly good on a double bounce.
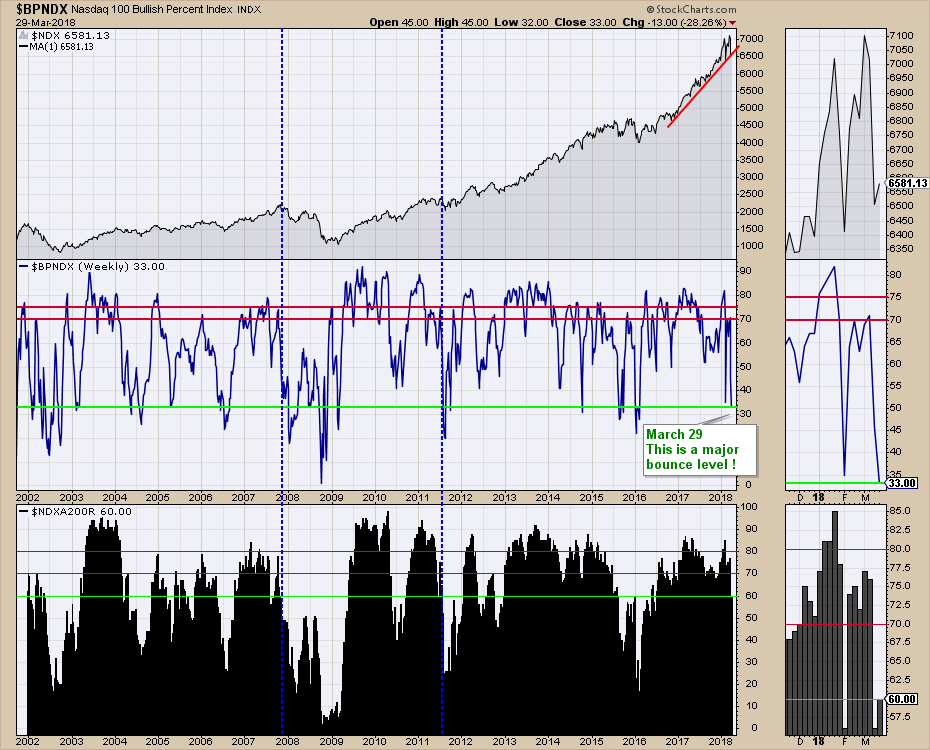
The $NDXA200R shows the percentage of stocks above the 200 DMA for the NASDAQ 100. This is an important level. With at least 60% of the stocks above the 200 DMA, this is strong support. So this makes a good trading level. If the market can't hold up here, it is probably a bigger decline coming so a tight stop is warranted.
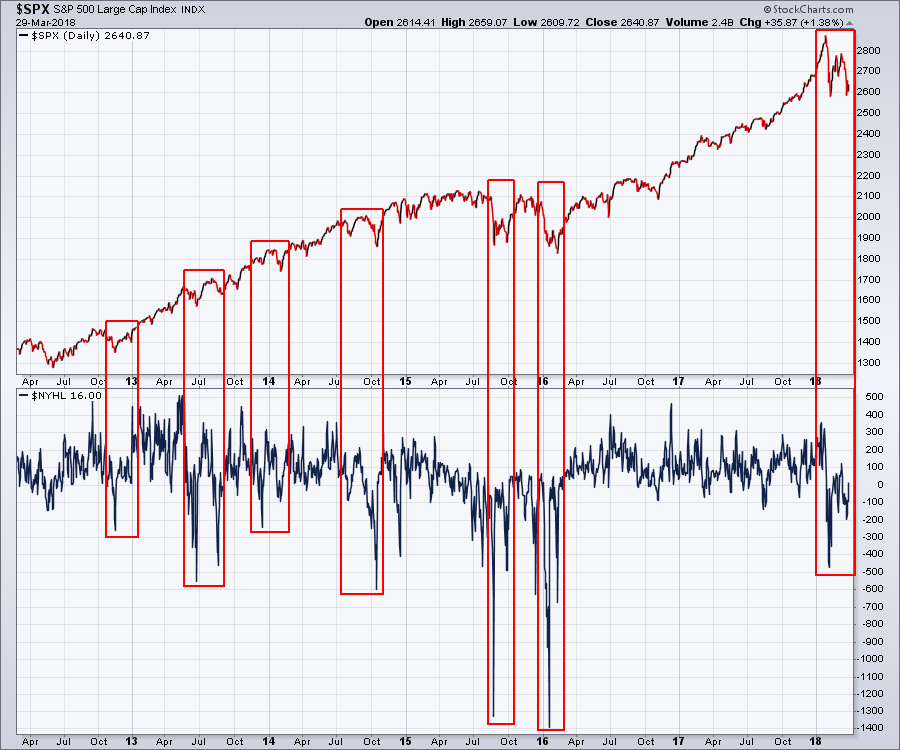
One of the other indications is a typical bounce pattern from some of the recent corrections. While some of the corrections look smaller in history, most of them have a higher low on the $NYHL as the price tests the previous low. One exception is the October 2014 low. This chart is not a bad template for trying to buy the secondary low. So far the setup is similar to the others. The bounce today with a 2% gain in the NASDAQ 100 looks like a successful bounce to me.
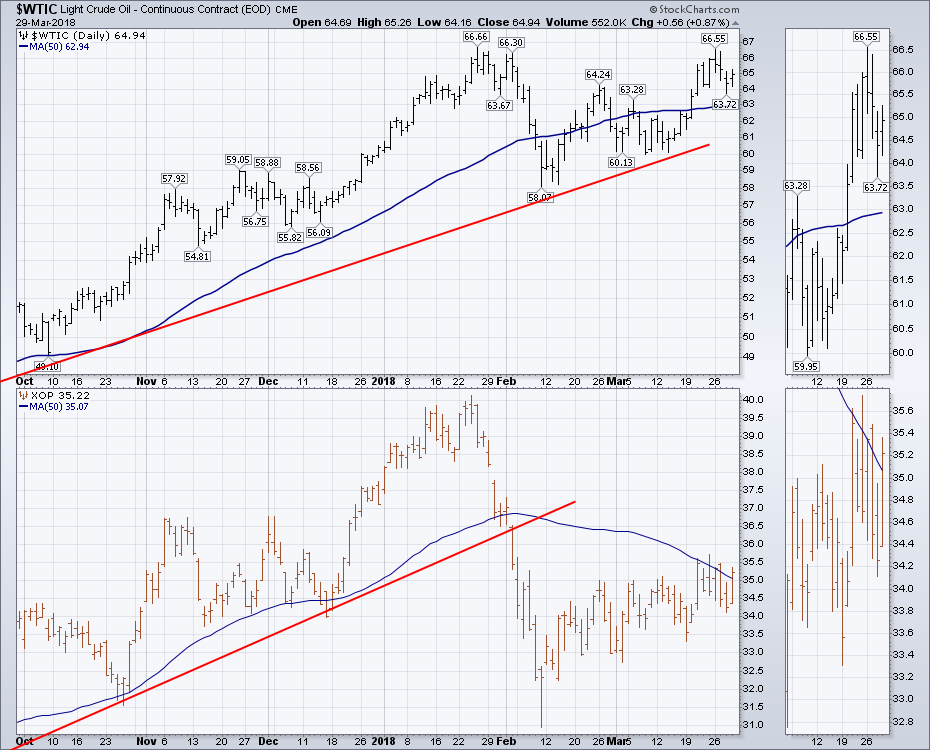
 Crude unchanged
While the $CRB has wandered sideways for 6 weeks, it is still above the 20 week moving average. Crude is at a very vulnerable point and weighs heavy on the $CRB index. Crude Oil is holding above the 50 DMA and the Production and Exploration ETF (XOP) moved back above today. Notice how well they work together when both above the 50 DMA. The real concern is the double top in crude oil. This needs to be watched closely.
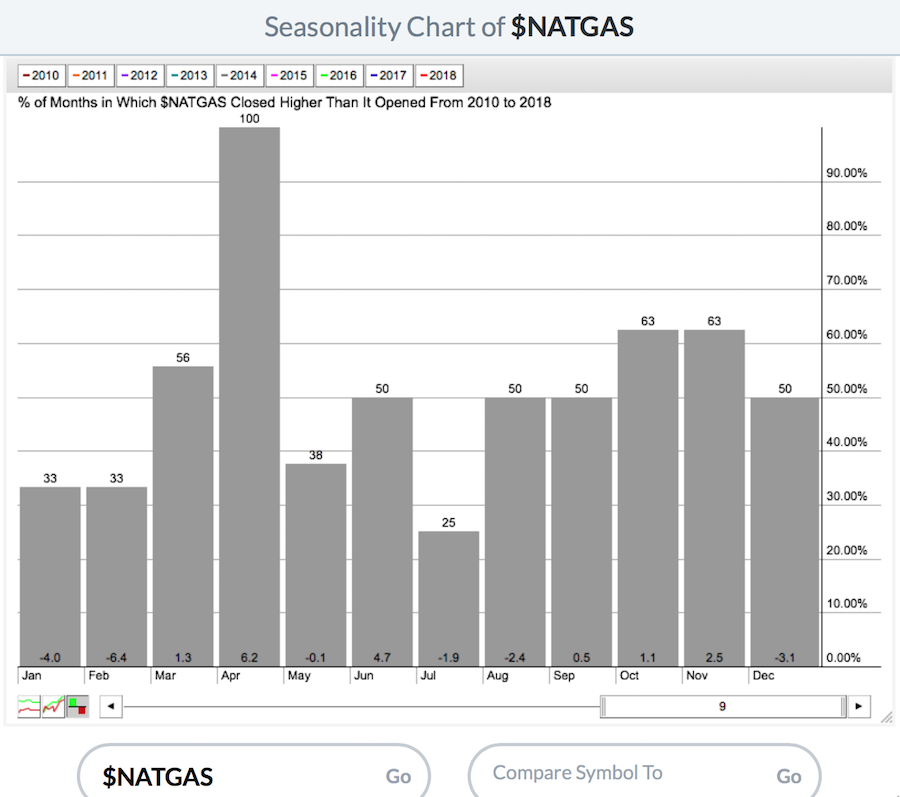
 Natural Gas gets set for April
A friend on Twitter sent me a chart showing the seasonality of Natural Gas ($NATGAS). $NATGAS has a great seasonality profile that starts Monday.
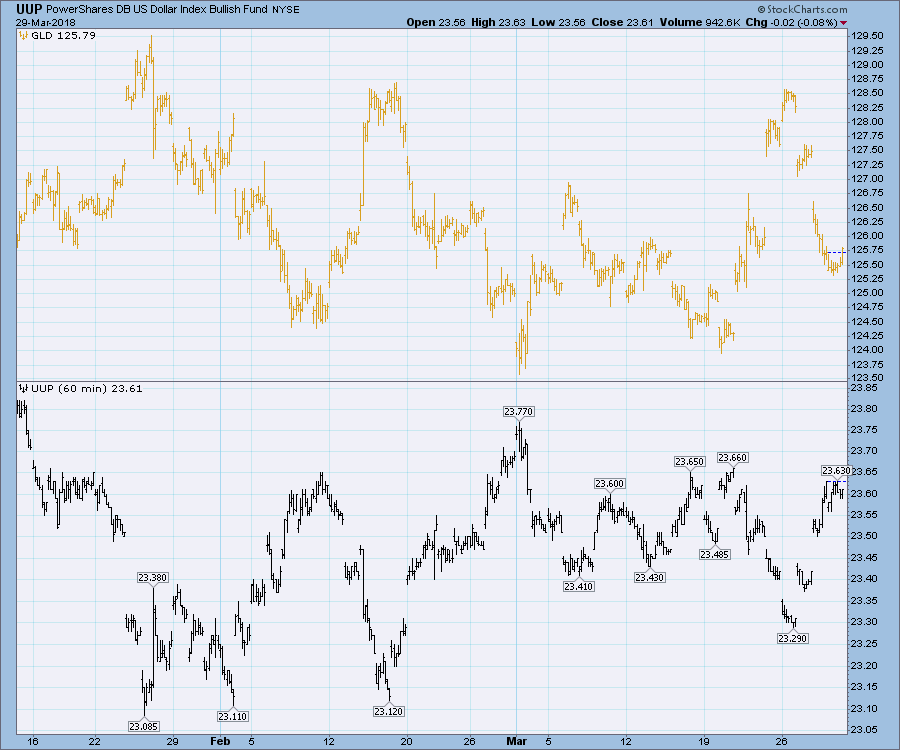
Dollar spins back to the top of the 11 week range
The US Dollar ($USD) went on a wild swing this week. There is an 11-week range in the US Dollar. From a new six week low on Monday, the Dollar reversed to the top of the range. While that may not sound like a big deal, it also coincided with a reversal in Gold at the top of the range. Gold traders beware the direction of the Dollar. They look extremely correlated (inverse).
Currencies are vulnerable to major trend changes now
When we look at the Dollar, it looks like it is ready to turn higher. While it is early days on many of my signals, I cover all of the currency pairs in the video. Suffice it to say, we are in a critical spot week after week as the dollar continues to gyrate. One of my favorite indicators, the PPO, reversed and triggered to the upside on the Dollar chart below after the PPO looked like it was going to turn lower on Monday. This PPO signal suggests the Dollar is about to ramp higher. While the Dollar made new 6-week lows today, does that sound like a bar that signals an upside breakout? Again its the first week of the signal, but I don't want to get caught offside on the precious metals if this starts to soar. As the dollar is a big anchor for most of the asset markets, beware of changing tides.
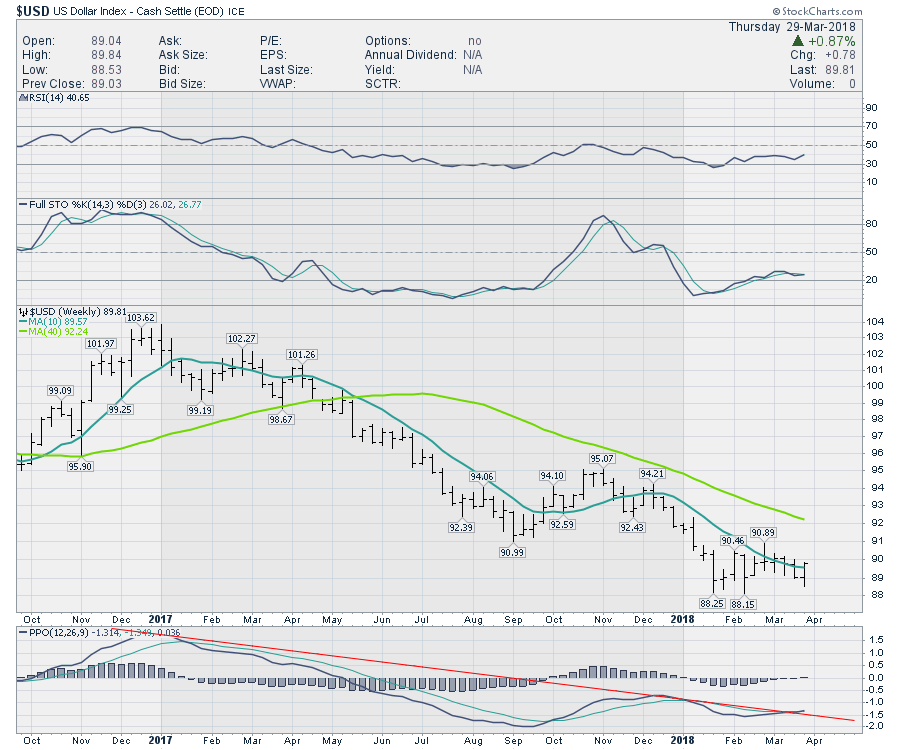 I have covered off how significant the break on the weekly PPO is on many recordings, but with every analyst talking about a declining US Dollar on TV, this would be one of the first signals that the downward direction in the dollar is over.
Global Indexes give monthly sell signals
The list of monthly sell signals that fired on the PPO indicator this month is significant. The Shanghai ($SSEC), the German market ($DAX), the French market ($CAC), the Dutch market ($AEX), and the Canadian market ($TSX) have all given a sell signal.
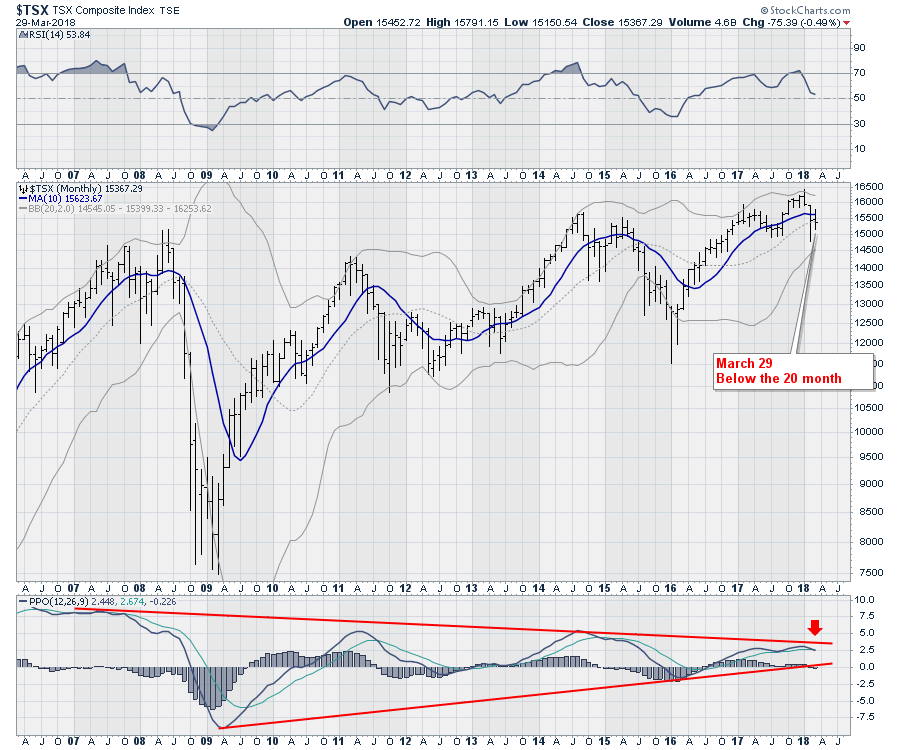 Look how important the monthly sell signals are. While we still have many nations that have not broken the monthly, the first round have.
So a wild week. A potential low for equities and at least a good trading opportunity heading into earnings. The potential for major swings in the US Dollar. Monthly sell signals on multiple international charts. A potential double top in crude oil. Lots to focus on.
Here is a link to the Commodities Countdown video.
Of course you've heard I have a book published. Well, our book store at StockCharts is heaving with another massive shipment. If you wanted a handbook of tips and tricks for getting your StockCharts account running smoother, this would be it. If you are new to charting, this is a why-to-chart book and how to set up those charts. Perhaps your best friend needs one of these books as a gift to understand why you are so interested in charting!
 There are some nice reviews on Amazon. Go hunt them down there or click on the StockCharts Book Store to buy your copy today.
Good trading,
Greg Schnell, CMT, MFTA
