 For the last couple of decades I have classified myself as a trend follower. Mind you, this is not market timing. Market timing involves guessing at tops and bottoms. A trend follower will NEVER get in at the bottom or out at the top. It depends on how quickly his/her trend measures identify a trend that determines when to go long after a bottom and exit after a top. I need to quickly clarify that I do not participate in the downside, only long positions, with cash being such a position in down markets.
Let’s first talk about some things about the market that I see misunderstood by many. One is the frequent mention that is often heard in the financial media that when the market is up they say there are more buyers than sellers and when it is down they say there are more sellers than buyers. This is total nonsense and a clear message that they do not understand how the secondary market works. The secondary market is the market that you trade in, whereas, the primary market is capital raising through IPOs and secondary offerings. They call them secondary offerings just to help confuse you. Let me explain this more buyers than seller nonsense.
When you buy a stock, I assume most of you believe that it is bought with the hope of selling it sometime in the future at a higher price; sometimes thought of as a greater fool. Not a bad idea. Someone had to sell you that stock. There is no stock sitting on a shelf somewhere. You might assume also that whomever sells you the stock might have an opposite view about the future of that stock. This may be true, but in reality you have no idea why the stock was sold to you or who sold it. They might have already made a nice gain in it and you are their greater fool. The bottom line is that it is an auction market made up of buyers and sellers and in effect a zero sum game. A proper way to describe an up market would be to say there is more buying enthusiasm than selling enthusiasm. Markets trend because as it moves up, buyers understand they will have to bid more for the stock and sellers know they can ask more for it. This continues until that supply and demand event dissipates. This is also the real beauty of technical analysis as that price is an instantaneous view of supply and demand.
Another comment from the media, gurus, experts, etc. is the comment that there is cash on the sidelines. Absolutely total nonsense! While an individual or institution can move to cash, they can only do so if someone buys their stock, so the blanket statement that investors are moving to or holding cash is wrong. What would be important is to know WHO is going to cash, but again that is difficult to find out. If you watch financial television pay attention to how many make these foolish comments. And then ask yourself, if they have that misconception of the how the market works, what else is it they say that is wrong. Eventually, you will turn off the noise.
Okay, back to trend following. If you are going to be a trend follower, the first thing you have to decide is what the minimum length trend you want to follow is. Often I see this important first step ignored. I do not know how one can create indicators or set indicator parameters without answering this critical first step. Maybe they just say they are trend followers just to be cool and don’t actually trade. Let’s say you want to invest based upon daily data and trade only once or twice per month. There are an average of 21 trading days each month, so you would set the parameters on your trend indicators in the 15 to 18 period range, or anyway that is how I would do it. So let’s walk through a scenario, the market starts to rise and after a week or so your trend measures start to pick it up and you begin to commit assets to the market. I’m not going to get into the money management of this process as it would take too long and make a good article later. The market continues to rise, you are invested; so what tells you when to get out? Either you use trailing stops or you let your trend measures determine it. Stops will generally get you out sooner but often can result in whipsaws, which however are usually not as painful as waiting for your trend measures to reverse. These rules come under the money management process.
There is an additional element to trend following that is often ignored and that is trend duration. How long does a market remain in an uptrend? What determines that? There are many ways to do this, but I prefer to use a simple process. If a market is in an uptrend, then it is considered an uptrend as long as there are no pullbacks greater than a certain percentage, in my case about 5 percent. The opposite is true for down trends, but again, I’m long only. In my book, “Investing with the Trend,” I beat this concept to death. So, let’s review. A trend, once in place, as determined by your trend measures, will remain in place as long as there is not a pullback greater than X percentage. We have now covered the philosophical aspect of trend following, putting it into action is a completely different subject.
This type of analysis can also help you determine which markets to trade as a trend follower and which to avoid. A consideration that is needed then is to measure uptrends as a percentage of all market movement, which includes the down trends and sideways moves. Or one can measure the uptrends as a percentage of only the trending data which is the uptrends as a percentage of the total of up and down trends. The difference between these two methods will yield the non-trending data, which is important to know if you want to be a trend follower. Table A below is Table 10-17 from my book that shows both trend analysis methods and the trendless information. This table uses data on all the sectors on a wide range of periods and pullback percentages. You will also notice that I’m not very good at marketing since I called them Trendiness One and Trendiness Two. Oh well.
Below are the descriptions of the various data in Table A.
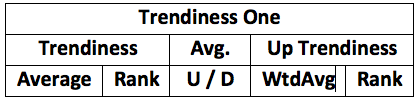
Trendiness Average - This is the simple average of all the Total trending expressed as a percentage. The components that make up this average are the Total Trendiness of all the raw data tables in which the total average is the average of the up trends and down trends as a percentage of the total data in the series.
Rank – This is just a numerical ranking of the Trendiness Average with the largest Total Average equal to a rank of 1.
Avg. U / D – This is the average of all the raw data tables’ ratio of up trends to down trends. Note: if the value of the Avg. U / D is equal to 1, it means that the up trends and down trends were equal. If it is less than 1, then there were more down trends.
Up Trendiness WtdAvg - This is the product of column Trendiness Average and column Avg. U/D. Here the Total Trendiness (sum of up and down) is multiplied by their ratio, which gives a weighted portion to the upside when the ratio is high. If the Average of the Total Trendiness is high and the Up Trendiness is considerably larger than the Down Trendiness, then this value (WtdAvg) will be high.
Rank – This is a numerical ranking of the Up Trendiness WtdAvg with the largest value equal to a rank of 1.
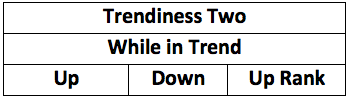
Up – This is the average of the raw data Up Trends as a percentage of the Total Trends.
Down – This is the average of the raw data Down Trends as a percentage of the Total Trends.
Up Rank – This is the numerical ranking of the Up column, with the largest value equal to a rank of 1.
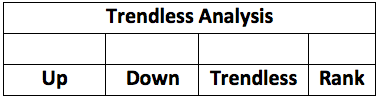
Up – This is the Total Trend average from Trendiness One multiplied by the Up Total from Trendiness Two.
Down – This is the Total Trend average from Trendiness One multiplied by the Down Total from Trendiness Two.
Trendless – This is the complement of the sum of the Up and Down values (1 – (Up + Down)).
Rank – This is the numerical rank of the Trendless column with the largest value equal to a rank of 1.
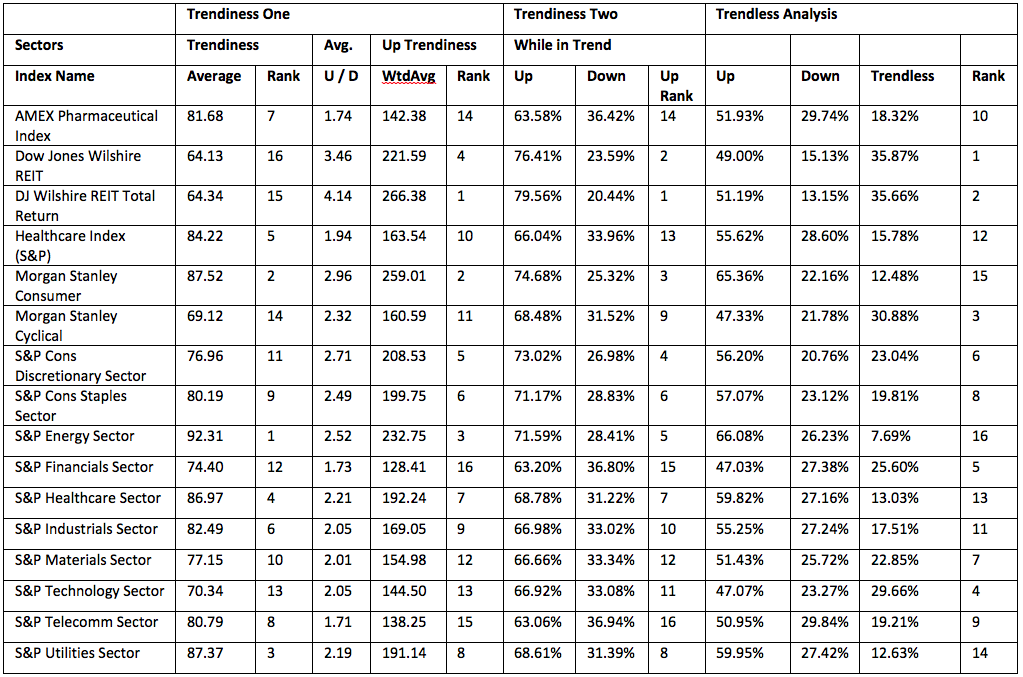
Table A
Let’s see what the data in Table A tells us. We would think that the high ranking sectors for trendiness would be the low ranking sectors for trendlessness (is that a word?). I think you can see that this is generally true. For example the S&P Energy Sector was ranked as follows:

It was first, third, and fifth in trending ability and last (16) in being trendless. This would be a good sector to use trend following on. Others would be Morgan Stanley Consumer and S&P Healthcare. Clearly the top two ranked sectors for trendlessness are Dow Jones Wilshire REIT and Morgan Stanley Cyclical. I did not mention the other REIT for obvious reasons. These are the ones to avoid with trend following strategies. It is interesting that the two REIT sectors ranked high in up trends only, which means their overall trendlines was low, which caused the disparity in data. One could massage the data enough to get the results they want, but I won’t.
One can easily look at a chart of any issue and probably see whether it trends or not. My process does essentially the same thing supported by a rigorous numerical process which is the method I prefer. Hopefully I have whetted your appetite to do your own research into trend analysis. You will find that the learning process is rewarding and if you come up with something that seems to work well, it will be much easier for you to trade it, instead of using someone else’s work. Isaac Newton was a trend follower.
Greg Morris


