 Welcome to being human! Do you really know that person you see while shaving or applying makeup? If you are going to be a successful investor/trader, you better get to know him/her and know them really well – like the back of your hand. As a human being, you were born with some unusual traits that most of us cannot override or rid ourselves of, such as keeping your eyes open when you sneeze or blinking periodically. While these have nothing to do with the market, they do serve as a lead into the human frailties known as heuristics. As an adjective, heuristic pertains to the process of gaining knowledge or some desired result by intelligent guesswork rather than by following some pre-established formula. As a noun, a heuristic is a specific rule-of-thumb or argument derived from experience.
We all have rules of thumb that we have employed over the years, whether knowingly or by habit. In general, they can serve us very well. However, when it comes to trading/investing, they can be the cause of not only frustration, but financial ruination. Understanding them and knowing when they tend to surface can help you overcome them. It is always better to be on the ground wishing you were in the air than being in the air wishing you were on the ground. I’m going to present a few that I think are important to technical analysts along with examples as to why they are important. Before I begin I have to be honest and tell you that I’m just going to ramble through a bunch of thoughts I have on the heuristics that I think are very important and that you should be aware of. You can go on the internet and find more academic definitions and vastly more information; at the end I'll give you a couple of good websites and my favorite book on the subject.
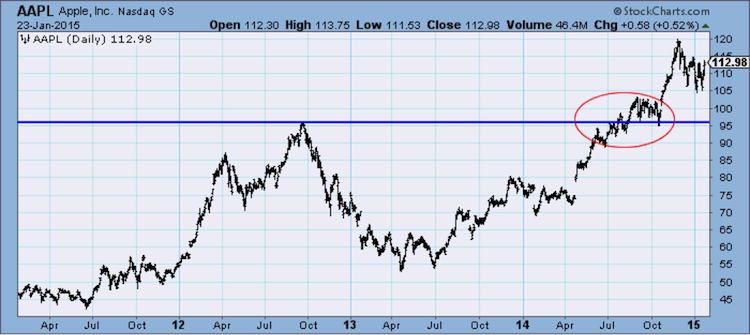
Anchoring – Most people are susceptible to this and I do not think it has anything to do with whether they are good at math or not. Here’s an example. You decide to buy a stock; the reason why is not important, but when you do complete the transaction, you know exactly what you paid for the stock. Chart A below (Apple) is a good example. Personally, I’m now excited because it was the first stock I looked at to find an example. I did not spend hours trying to find a perfect textbook example because in the real world the perfect scenario doesn’t surface that often. This example is about a novice, certainly not one of you. For whatever reason you want to own apple. There was a peak in prices near the end of March, 2012, and you said to yourself after it started to drop that it was a buying opportunity, so you bought it in early May just as it was bottoming and it rose until late September. Trust me I know the genius-like feeling you were experiencing. The stock now begins to sell off and continues down for the next 8-9 months. You are going through all the emotions one has by continuing to hold onto a loser, yet you still hold on.
In your mind, you tell yourself if it ever gets back to that last peak you will sell it. Well it finally does, almost 2 years after you bought it. Now what? Your emotions have totally reversed as it has been in an uptrend for a year or so. All your earlier thoughts about selling it are gone, that is, except for one – you still remember to the penny how much you paid for the stock. When the price gets back to the last peak price of about $95, you can see there was considerable hesitation in the price movement before it eventually continued upward. One cannot know what caused this, but it might be that you were not alone in buying the stock at a previous high price. Trust me, having company does not help things. This is one of the reasons I believe that horizontal trendlines (trendlines based upon a price) are the absolute best ones to use as they often represent good areas of support and/or resistance. Do not be lulled into thinking these support and resistance areas (red oval) can be identified by an exact price – only an area close to that price. And finally, I doubt you sold it at that level even though it sounded reasonable a year or two prior to reaching it. This is not uncommon for investors who operate without a set of rules and/or a process. Sit at your computer and go through a bunch of stock charts and you’ll see this scenario often. Also remember that anchoring can also cause you to under react to new information.
Confirmation Bias – I’m not sure if anchoring is more common than confirmation bias but it is close – and yes, that is a straw man argument since I can’t prove either way. When you watch the parade of experts, gurus, pontificators, etc. on the financial media, you will begin to pick up on their ability to make a market prediction and follow it up with all sorts of evidence that fully supports that prediction. Confirmation bias can also be closely related to the foolishness that the more supporting information one has the better chance for success. I think it is the quality of information that makes the difference, not the quantity. However, one has to deal with the space between their ears and often confirmation bias is what it takes to pull the trigger. Occasionally you will hear an analyst offering an opinion and then not only supporting evidence (confirmation bias), but also offers why it might not work. Ugh! I’m sure those are the ones that never get invited back – I hope. Indecisiveness has no place in market analysis. That is different than making dynamic decisions; those that can be altered when the evidence changes.
Herding – Lemmings! Being part of a large group can make you feel secure, however, when it comes to many things, especially investing, this can be devastating. There are books written on this subject and closely tied to contrary opinion. Know what the crowd is doing and do the opposite – easier said than done. I think one of the problems here is not that this is true, but it is difficult knowing what the crowd is doing. Too subjective in my opinion. Often you will hear the talking heads say that the smart money is on the sidelines, but my question to them is twofold. First, who do you believe is the smart money, and second, how do you know they are in cash? This is a perfect example of the talking heads just talking and saying anything that sound believable and cannot be disproved. I can see I drifted off subject a bit, but still closely related to herding. Herding is the comfortable feeling of following the crowd. When I spent time on a farm growing up in Kansas this had a different meaning altogether. Another point related to crowd behavior is when someone yells “fire” in a crowded theater. Everyone runs to the exit and there is usually some problems with getting everyone out. In the stock market, when there is a big selloff (yelling fire), the difference is that you cannot just run to the exit, you first have to find a buyer of your stock(s) and then you can run for the exit. Sadly, there are not a lot of buyers around in the early stages of a market fire.
Hindsight Bias – This is extremely common and often those who do it, truly do not realize it. Probably because one of the basic premises of technical analysis is to study the past. Hindsight bias has a lot to do with your education, the way you were raised, and a whole bunch of other things that affect your way of thinking. This is a very important heuristic to be aware of so that you can concentrate on avoiding it. Nassim Taleb says it is the same as Monday morning quarterbacking. Remember, the only real analysis comes at the extreme right side of the chart, everywhere else is just for education purposes.
Overconfidence – I’m almost positive that I would not have to say anything about this one. It is obvious. Well at least to those who see it in other people. It may not be so obvious in ourselves. I think overconfidence is easily obtained merely by being successful. When a large group of investors is asked if they think they are above average, a surprising number above 50% says they are, even when told they are only asking about the people in the room. The reality is that only half of them are above average. Most people think they are above average – it is certainly a relative thing. Overconfidence can cause you to rely upon gut feelings instead of solid research. Do not confuse overconfidence with pride and personal satisfaction.
Recency– This is simply stated as people who think the most recent information is the most important. Fresh information has to be better don’t you think? It is all so natural to think this way, yet often fresh information can not only be misleading, it can be completely wrong. The problem for investors is that this tends to cause them to forget or overlook older information; information that remains as it has upheld the test of time. When I use stops (which is always) I allow a 30 minute window so any news-related sell-offs can be corrected before I actually sell. Is it just me, or are you tired of the term breaking news? Isn’t all news breaking? The really nice thing about getting old is that all information is relatively new.
Bias Tracks
I took some of this out of “Investing with the Trend,” Chapter 6, The Enemy in the Mirror.
The following is my attempt to tie some of these behavioral biases together and see how they flow from one to another and eventually into technical analysis techniques (underlined). Many more heuristics are mentioned here than above, hopefully you’ll spend some time reading about them.
1 - Communal Reinforcement causes Selective Thinking which causes Confirmation Bias which can cause Self Deception which leads to either Self Fulfilling or Self Destructive. If Self-fulfilling, it can lead to using Price which can lead to using Support and Resistance. If Self Destructive it can lead to using time which can lead to using Calendar Effects such as Weekend Effect, January Barometer, January Effect, etc.
2 - Status Quo Bias can lead to Anchoring which can lead to Support and Resistance. It can also lead to Loss / Risk Aversion which can lead to Under-reaction, which is typically associated with the short term.
3 - Self Deception can lead to Self-Attribution and Overconfidence. Overconfidence can lead to Hind Sight Bias and Representativeness. Representativeness can lead to Overreaction which is typically associated with the long term.
4 - Since anchoring is often associated with framing, here is a simple example of how framing can work. I ask people how to pronounce the capitol of Kentucky, is it Lewisville, or Louieville? I just framed the question. I hear an even amount of both from the audience. The correct answer is Frankfurt. This is particularly interesting when I’m doing this while in Kentucky.
5 – Herding, disposition, confirmation bias, and representativeness can provide justification for trend following. Information is not dispersed evenly across the investor universe, especially for illiquid assets or if the information has much uncertainty, which leads to under-reaction. If investors are reluctant to take small losses then momentum is improved by the disposition effect.
6 - Herding leads to Trend analysis. And finally, Overconfidence can lead to ruin.
The field of behavioral investing has grown significantly over the past twenty years. I think this is because it offers some solutions to problems that modern finance previously could not address. Trust me, any theory that begins with the assumption that investors are rational needs all the help it can get.
My absolute favorite book and one I bought for my adult children is James Montier’s “The Little Black Book of Behavioral Investing.” The subtitle is “How Not to Be Your Own Worst Enemy.” You can read this in an afternoon and you will be amazed at how many times you think he is talking directly to you. I suggest reading it at least once a year. Martin Sewell maintains a great behavioural finance site at http://www.behaviouralfinance.net/ and Tim Richards maintains the behavioral bias site at http://www.psyfitec.com/. Be sure to navigate to his The A to Z of Behavioral Bias page. Final test question: Of the two websites above, which one is British?
Take a good look at that person looking back at you in the mirror. He/she could be your biggest enemy when it comes to investing.
- Greg Morris
