 Please remember, these articles that cover various chapters in the upcoming book are not the complete chapter, only highlights that I have selected. The book is nearing completion.
CH 7 New High New Low Indicators
This Chapter contains all the indicators that are dedicated to using New Highs and/or New Lows.
New High New Low Indicators
High Low Difference
New Highs – New Lows
New High New Low Line
New Highs & New Lows Oscillator
New Highs & New Lows Derivations
High Low Ratio
New Highs / New Lows Ratio
High Low Miscellaneous
New Highs & New Lows
New Highs % Total Issues
New Lows % Total Issues
High Low Logic Index
High Low Validation
High Low Difference
New Highs – New Lows
Data components required: New Highs (H), New Lows (L).
Description: This is the difference between the daily new highs and new lows. If the new highs outnumber the new lows, the indicator will be above the zero line. If the new lows outnumber the new highs, it will be below the zero line. Without some sort of smoothing or rate of change it is a very noisy oscillator.
Interpretation: Basically it can be used as an overbought oversold oscillator, similar to the advance decline overbought oversold indicator. Chart 7-1 shows that by smoothing it by 21 days takes out much of the noise and then can be used for bullish and bearish signals as it crosses the zero line.
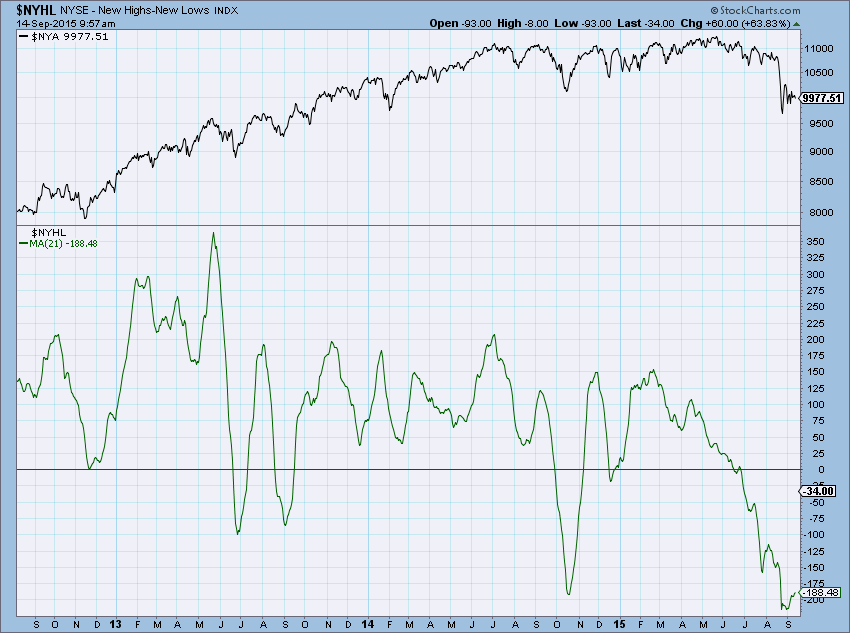
Chart 7-1
Author Comments: In its raw form this is not useable other than to get a feel for the number of new highs relative to the number of new lows. A better derivation for this would be to look at the difference as a percentage of total issues. Tim Hayes of Ned Davis Research gives the following information using weekly data. When this weekly indicator is above 8.8% it is bullish and when it is below -3.6% it is bearish. Chart 7-2 shows Hayes’ thresholds along with an overlay for identifying buy and sell signals. Whenever the difference is above the upper (8.8%) threshold the value is +30 and when below the lower (-3.6%) threshold it is -30.
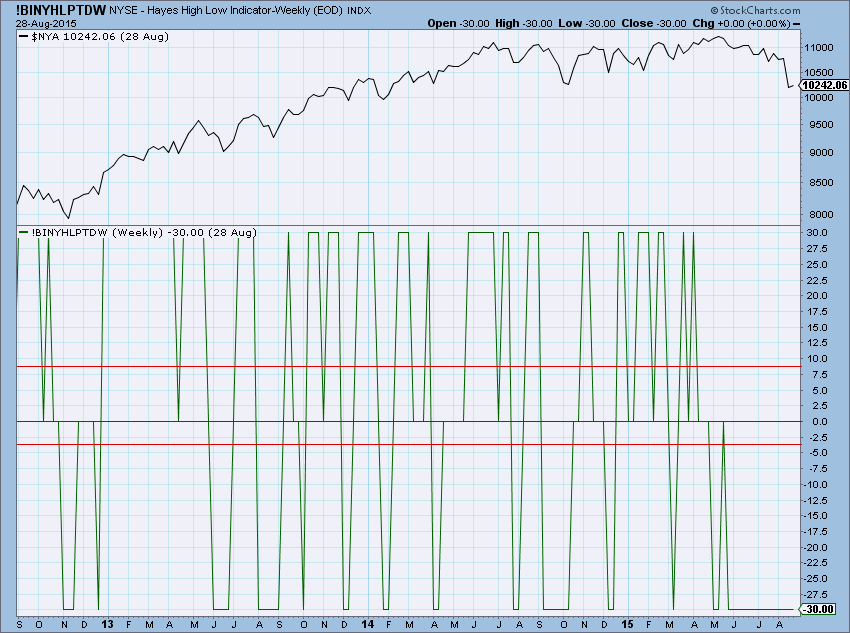
Chart 7-2
Formula: (H – L)
StockCharts.com Symbol: !BINYHLPTDW
References:
Hayes, Timothy. The Research Driven Investor. McGraw-Hill, 2001.
Author Note: This is a great book, but unfortunately it is out of print. I strongly recommend it if you can find a copy.
High Low Logic Index
Author/Creator: Norman Fosback
Data components required: New Highs (H), New Lows (L).
Description: This is an indicator that uses two ratios: the new highs divided by the total issues, and the new lows divided by the total issues. The High Low Logic Index uses the lesser of the two ratios on any given day and then exponentially smoothes it by 50 days. Note: Fosback used weekly data for this indicator with a 10 day smoothing.
Interpretation: The concept is that either a large number of issues will reach new highs or will reach new lows, but normally not at the same time. Because the indicator uses the lower of new highs or new lows, a low reading on this indicator could indicate a strong trend. If you think about it, it is somewhat of a consensus indicator based on new highs and new lows. When it reaches a high reading, it means that there is something inconsistent about the market and it is not a good sign. Chart 7-24 also shows the individual new highs and new lows (dotted line) in the middle and the high low logic index on the bottom. This chart uses daily data adjusted for Fosback’s parameters. You can see in chart 7-24 that when the market is trending, the indicator is at its low points.
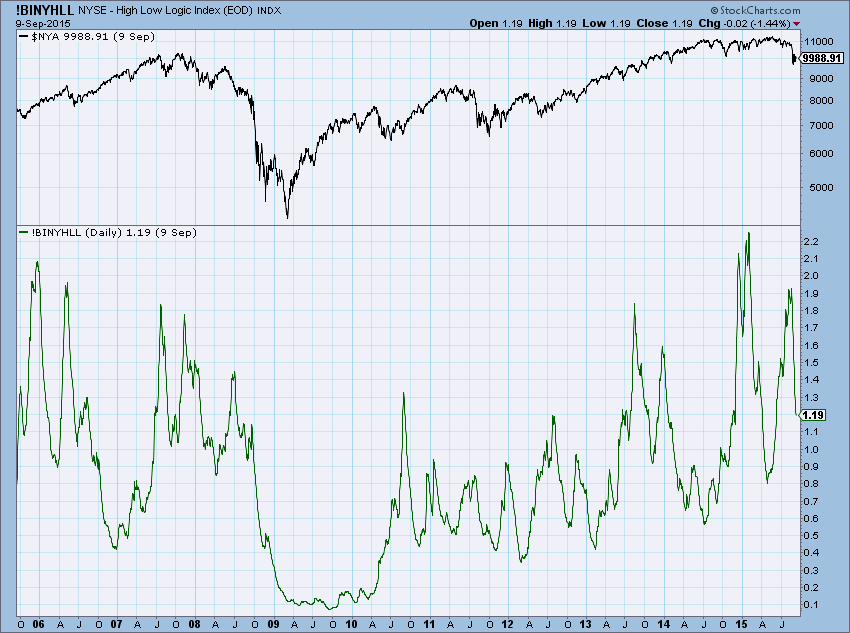
Chart 7-24
Chart 7-25 uses weekly data as preferred by Norman Fosback. Close examination of the daily and weekly versions does not yield much difference. This is because new high and new low data is based upon a much larger time frame.
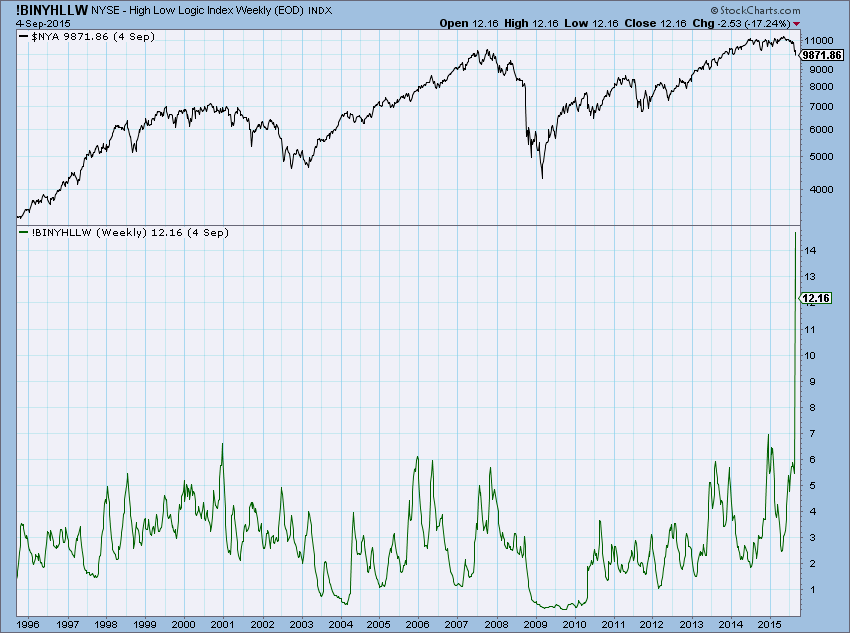
Chart 7-25
Gerald Appel uses a slight modification to this indicator. He uses the lesser of the two ratios of new highs to total issues and new lows to total issues. Because he also used weekly data for the new highs and new lows, I adjusted his sell parameter to 2.4 as shown in chart 7-26. This version seems to identify tops when it rises above 2.4.
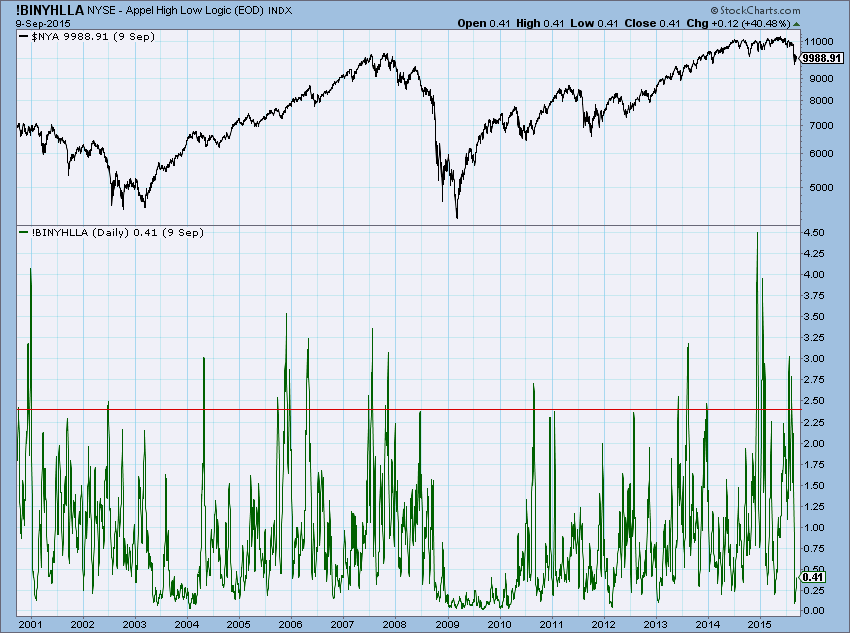
Chart 7-26
Author Comments: I think that the weekly data was easier to work with when there were no personal computers and that accounts for its use in some of this older indicators. I also believe there isn’t much difference in using weekly data versus daily data in regard to new highs and new lows since they are based on prices 52 weeks (252 days) ago. If an issue reaches a new high on Monday, it means it is the highest high value for that issue in a year. If the weekly new highs (Friday close) also reflect that, it is within less than 2% of representing the time of the new high. And that is the worst case scenario. The other days of the week are even closer, with Friday being the same as the weekly.
This unique concept is somewhat similar in concept to Wilder’s Directional Movement. The steady moves of the indicator either up or down can represent good trending markets. Look at the period between 1992 and 1997 (chart 7-25), a time of continuous market upwards movement. The high low logic index stayed at low readings much of the time, indicating there were many new highs (or new lows) being made.
I figured I would reverse the concept and created the Low High Logic Index as shown in chart 7-27. This is the opposite of Fosback’s indicator in that it uses the higher of the two ratios mentioned above instead of the lower. Setting a decision zone at 10 tells us that we are either at a new a market top or a market bottom. The good news is that the trend of the market up to that point should tell us which it will be. Like its complement, the high low logic index, it stays at low values during strong trending markets.
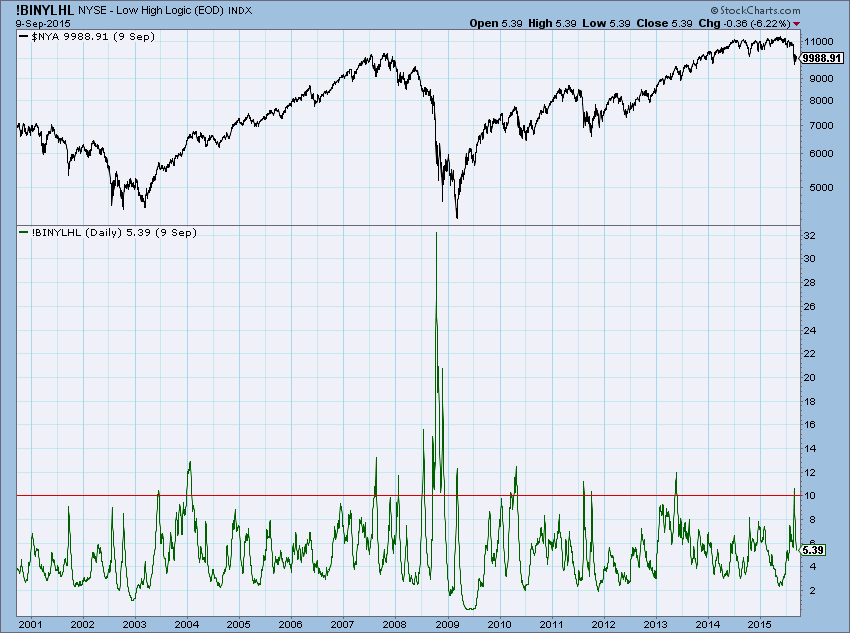
Chart 7-27
Formula: Previous Value + ((H / TI) or (L / TI) (exponentially smoothed by 50 days).
StockCharts.com Symbol: !BINYHLL, !BINYHLLW, !BINYHLLA, !BINYLHL
References:
Fosback, Norman G. Stock Market Logic, Fort Lauderdale, FL: The Institute for Economic Research, Inc., 1976.
Appel, Gerald, “Gerald Appel with Systems and Forecasts.” Stocks and Commodities, Volume 12, March 1994, pp. 98-105.
High Low Validation
Author/Creator: Greg Morris
Data components required: New Highs (H), New Lows (L), Market Index (MKT).
Description: This is an attempt to help validate new high and new low data and, to be honest, is still a “work in progress.” If you consider the facts relating to new highs and new lows, you will see the necessity for this. A new high means that the closing price reached a high that it had not seen in the last year (52 weeks). Similarly, a new low is at a low not seen for at least a year. This indicator tries to identify when the new high or new low is determined to be good or bad using the following line of thinking.
Consider that prices have been in a narrow range for over a year. Something then triggers an event that causes the market to move out of that trading range to the upside. This will immediately cause almost every stock that moves with the market to also become a new high. New highs are generally the force that keeps good up moves going. The new lows in this scenario will dry up, as expected. Now consider that the market has had a steady advance for quite some time. The number of new highs will generally continue to remain high as most stocks will rise with the market. Of course there will be drops as the market makes it corrections on its path to higher prices. When the number of new highs starts to dry up, you will probably notice that the number of unchanged issues starts to increase slightly because a lot of stocks will just cease to participate in the continuing rise. New lows will not happen for some time because the market is just starting to form a top. The number of new lows will increase as the market forms its broad top, while the number of new highs gets smaller and smaller. It will be the time frame of this topping action that determines when the new lows will start to kick in. Remember, you cannot have a new low until an issue is at a new low price over the last year.
When the market declines and you start to see fewer new lows, it means the market is losing its downside momentum. Why is this so? It is because some issues have already bottomed and are not continuing to make new lows. This is tied to the rotational effect, sometimes caused by various market sectors hitting bottoms at different times.
Interpretation: Chart 7-28 is an attempt to show this visually. Up spikes (solid green line) equal to +2 represent good new highs. Up spikes (shorter green line) equal to +1 represent bad new highs. Similarly, down spikes (solid red line) at -2 equates to good new lows and -1 (shorter red line) equates to bad new lows. You might read that again since it is not obvious. I wanted to keep the new highs as the up spikes and the new lows as the down spikes. Short up spikes are bad new highs and short down spikes are bad new lows. Bad, in this case means they did not conform to the theory talked about above.
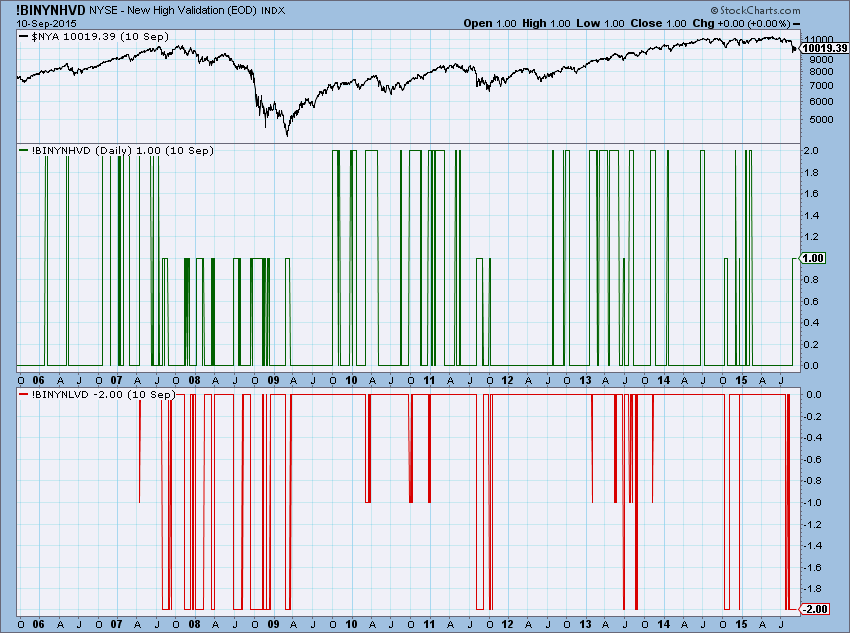
Chart 7-28
Author Comments: This method of trying to determine when the new highs and new lows are truly good ones, involves the rate of change of the market, a smoothed value of each component relative to the total issues traded, and their relationship with each other. For example if the market is in a rally (rate of change high) and the new highs are increasing, any new lows that appear are not good ones.
StockCharts.com Symbol: !BINYNHVD, !BINYNLVD
Trade well,
Greg Morris


