 Since the dawning of the Internet in the early 1990s, investors now have access to volumes of data and statistics that were only reserved for a select group before. There are some things you need to know about financial data that is readily available for your use. There are some problems that don’t seem to be addressed by those who should know better.
Daily vs. Monthly Statistics
Almost all of the financial statistics you see on mutual funds are based upon monthly returns. Did you ever wonder why some of the big mutual fund sites only show some statistics for funds that have at least 3 years of data? It is because they are only using 36 months’ worth of data returns to make the calculations. 36 months is barely into the realm of statistical significance, let alone enough data to account for the tremendous uncertainty in free market pricing. Daily data is and has been readily available for decades. Why isn’t it used? Surely the results of using daily data to generate the statistics would be more valuable to the investor, especially an technically oriented investor.
Chart A shows the returns on XYZ (hypothetical fund); they are daily returns for the first 7 months of 2006. A casual glance at the chart would cause you to say that the fund is quite volatile.
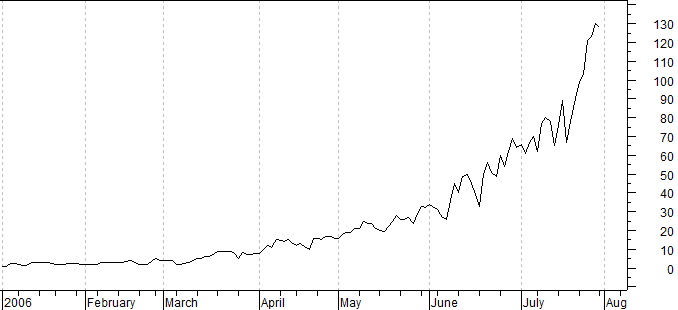 Chart A
Many times it is easier to see data over this range of returns if plotted in a semi-log scale as the Chart B shows. This is the exact same data only the Y-axis (return) scale has been changed to logarithmic scale. Again, it is easy to see that this is a volatile fund.
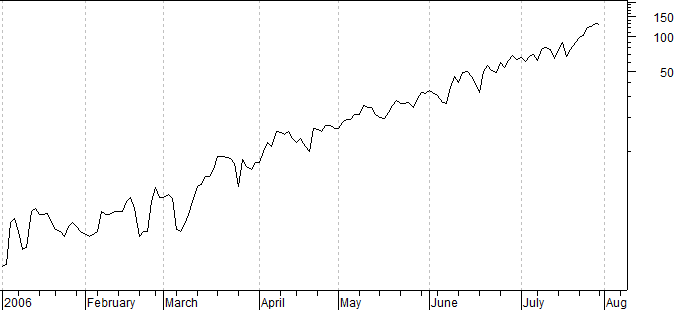 Chart B
Now, let’s plot the returns using the same data but this time only the returns on a monthly basis instead of daily. See Chart C. Oops, what happened? The volatility went to zero. I must be honest here as I spent a lot of time editing the data so that the monthly end data would fit this example. The month end data in Chart B was adjusted so that when you looked at just those dates you got the results shown in Chart C.
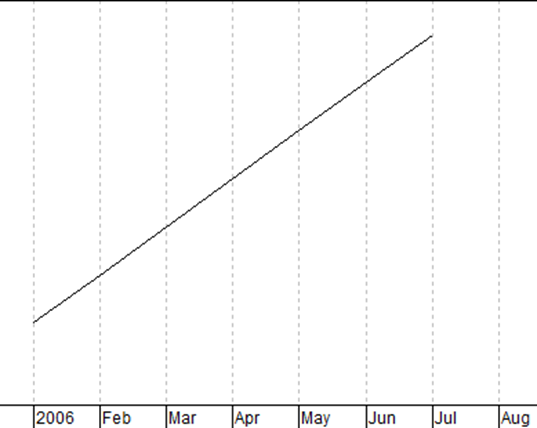 Chart C
This is a wildly hypothetical case, but hopefully you will agree that daily returns will give you a measure of volatility you can have confidence in, whereas monthly data just might be suspect, especially if you only have a few years of data.
The mutual fund industry is locked into monthly data; hopefully I shed some light on why you should work with daily data. Even though I had to play a little trick, I wanted to make a strong point. Without using any conjuring this time, Chart D below is the Nasdaq Composite for 1 year plotted using daily data. Chart E is the same time frame but plotted monthly. Seriously, do I need to say more?
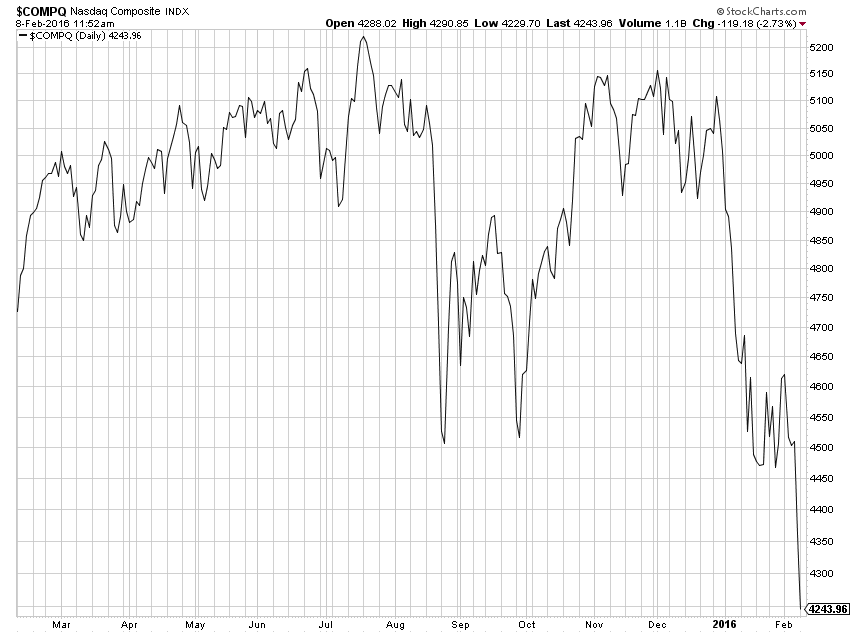 Chart D
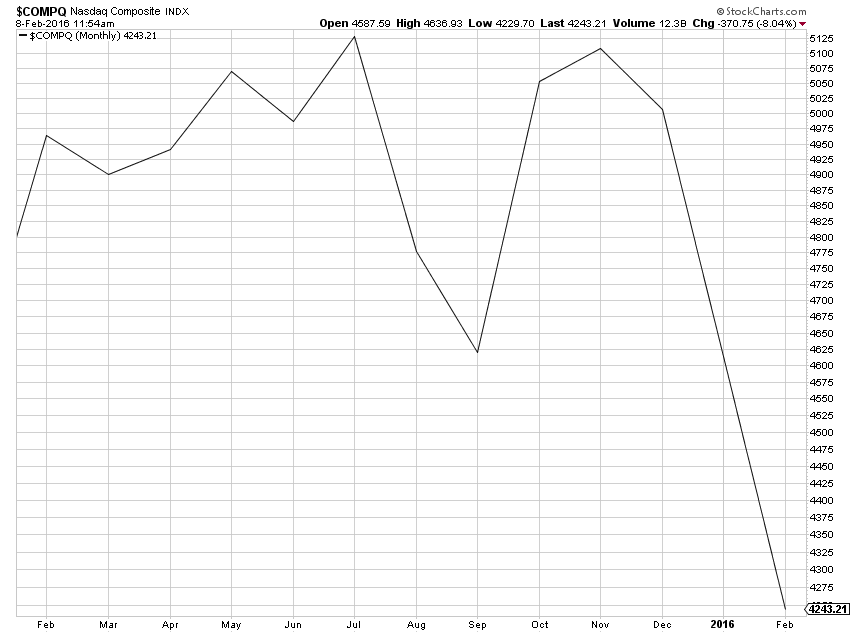 Chart E
About the only thing worse than using monthly data for analysis, is using monthly candlesticks.
Trade with the proper data,
Greg Morris
