 Candle patterns are predictable psychological trading pictures (windows) that produce reasonable forecasting results when used in the proper manner. This article will explain the technique used to determine the various statistics developed to show the success of candle patterns. Note that no magnitude of success is used, only a relative success and failure. Keep in mind, though, that success still means that the pattern correctly predicted the market move and failure means that it did not.
Using all of the information about pattern recognition (including trend determination) developed in the previous articles, we will now set out to see just how good candle patterns are. Because a simple approach is usually best, no elaborate assumptions were used, only the price change over various time intervals into the future. Those time intervals were measured in days.
Once the relative success or failure of a particular candle pattern was determined, its relationship to the appropriate pattern standard of measure was calculated. This standard of measure is the Reverse Current Trend and Continue Current Trend. Recall that continuation candle patterns must outperform reversal candle patterns because of their trend relationship. That is why you will see many continuation candle patterns with a negative ranking, even though their success percentage was high.
Table A was created so you could answer the following questions:
1. How well does each candle pattern perform?
2. When does each candle pattern perform the best?
3. When does each candle pattern perform the worst?
To use this table, you must keep in mind that a success rate of 50% or less is not any better than a coin toss and is of no value. The two highest and two lowest averages are emboldened in the last column. Notice that in all four cases the number of occurrences of those patterns was relatively small. They consisted of 92 patterns out of 701,402, which is only 0.013% (a little more than one in ten thousand). This table used only optionable stocks from the New York, Nasdaq, and AMEX Exchanges. There were 2,277 stocks, 5,490,000 days of data, and 701,402 candle patterns identified. The numbers at the top of the table, 1 through 7, reflect the number of days after the pattern was identified. You can see some were good initially, then faded off. Others just stunk the entire time, and some were good most of the time. If you see a pattern that seems really good on average also ensure that it occurred with enough frequency. For example, about 2 inches down from the top is 3 Stars in the South+, with an average of 67%, but only 9 patterns existed. I would ignore patterns like this. Like the last article I had to break the table into 3 sections so viewing and printing would be easier.
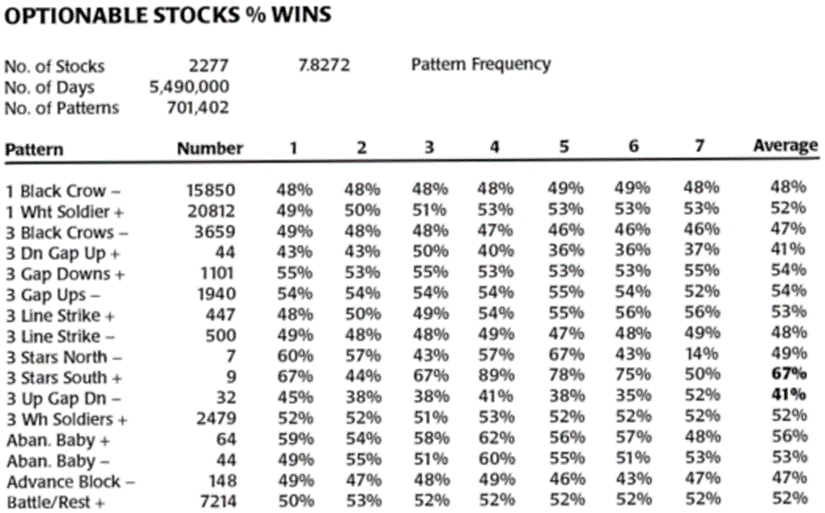
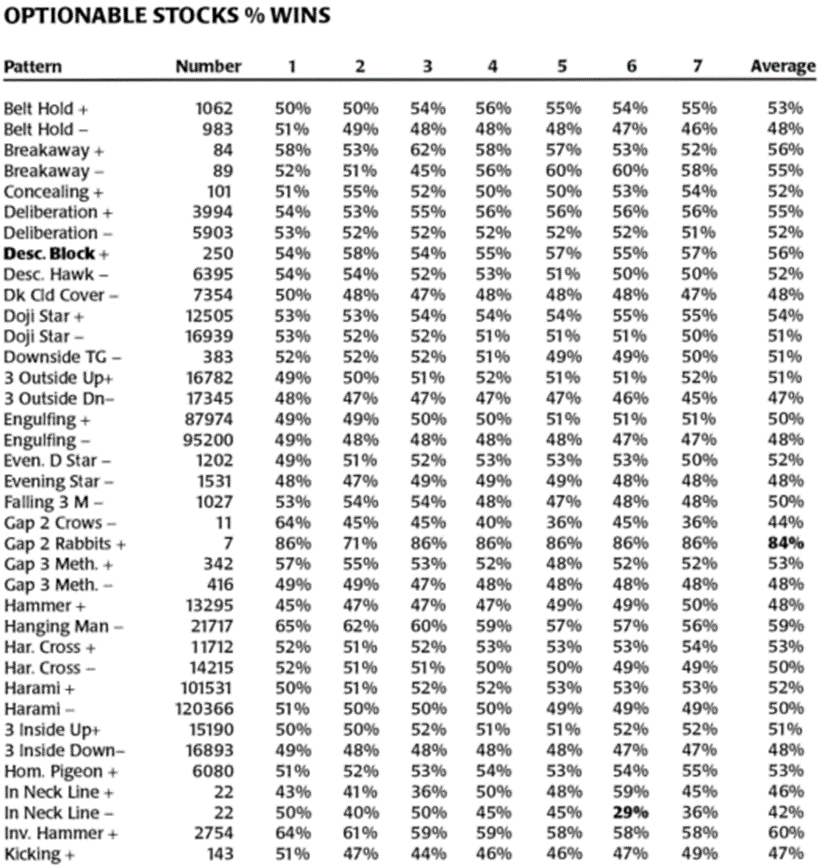
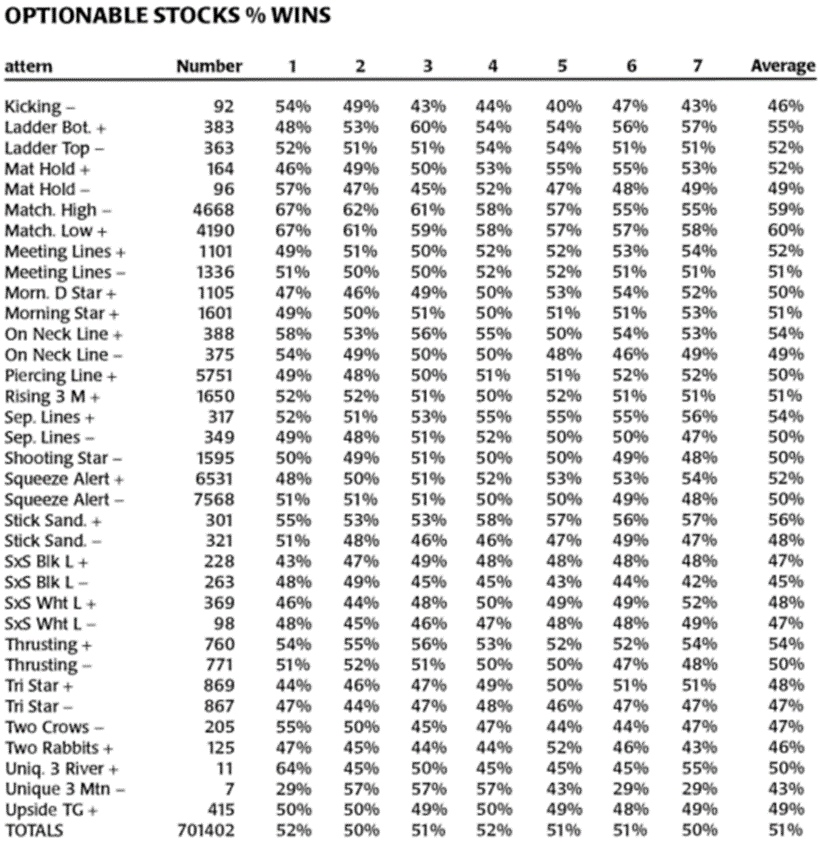
Table A
Notice the bullish Descent Block (Desc. Block +) pattern and how it maintained a good percentage of success over all seven prediction intervals. It averaged a 56% success rate, which is excellent. This is how you should use this table. You might notice slightly different statistics in Table B below from the data in Table A. That is because Table A only looked at the Optionable Stocks, while the statistics on the individual patterns in Figure B used all of the stocks on the New York Exchange, Nasdaq Exchange, and AMEX Exchange (7275 stocks).
Finally, the average of the averages for the seven prediction intervals is shown at the bottom of Table A. This offers further proof as to the merit of candle pattern analysis. While two of the intervals only did a well as a coin toss, the fact that most did better is good.
Table B shows the results of rankings based upon % Winner and % Loserss, the percentage of the time a pattern was successful versus being unsuccessful. The reciprocal of %Wins would be %Losses (100 - %Wins = %Losses). Each pattern was tested over the same prediction intervals and you can see the results for each of the 7 prediction intervals. The concept of Net Profit/Loss Per Trade will be the subject of the next Candlestick article.
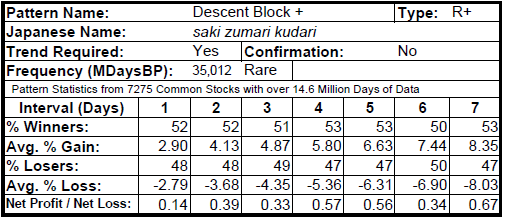
Table B
Dance with the Trend,
Greg Morris


