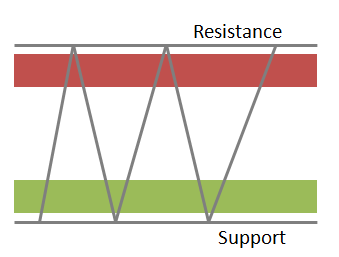
 Support and resistance are mainstays in technical analysis; sadly, misused and abused by many. The purpose of this article is to hopefully explain why they work when used properly. I have to admit that when I first got interested in technical analysis and charting, I drew trendlines all over the place. Once I began to fully understand the basic premise of technical analysis; that it is based upon price; price that is determined in the auction market by buyers and sellers. I have discussed my thoughts on trendlines in an earlier article but after 45 years only now consider horizontal trendlines since they are based upon price. I see others drawing trendlines all over charts connecting visually appealing points at bottoms and tops, often not with much accuracy. That is the only good thing they are doing; most non-horizontal trendlines should be drawn with a large brush or marker. Just switching from arithmetic to semi-log charts can change them.
There is an investing heuristic that I have discussed before called anchoring which directly applies to horizontal trend lines which also help define support and resistance levels. In many situations, people make estimates by starting from an initial value that is adjusted to yield the final answer. The initial value, or starting point, may be suggested by the formulation of the problem, or it may be the result of partial computation. In either case, adjustments are typically insufficient…that is, different starting points yield different estimates, which are biased toward the initial values. The previous three sentences were from “Judgment Under Uncertainty” by Kahneman, Slovic, and Tversky. My quick interpretation is that when someone buys a stock, they will always remember exactly the price they paid for it. Sadly, and too often, when it goes down in price, their goal becomes to wait until it gets back up to where they bought it to sell. Even more sad, if it ever does, they probably won’t sell it. That is anchoring.
Horizontal trendlines (those based upon price) are as fundamental to solid technical analysis as you can get. Price-based support and resistance works. When I discuss Japanese candle patterns or classical Western chart patterns (not often anymore) I remind folks that if they occur at significant points of price-based support or resistance their reliability will be much better.
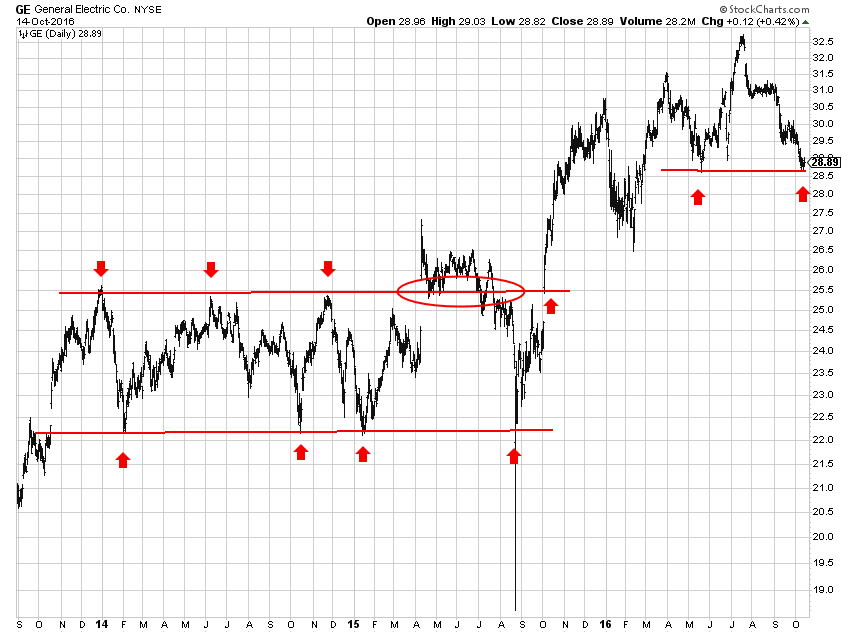
Chart A shows many examples of horizontal trendlines and how price rebounds and associates with them. The ellipse shows prices reacting with the trendline at 25.5. Shortly thereafter it breaks down, has a one-day huge spike down *, resumes trading at the lower trendline at about 22.2. It breaks out of the trading range with a gap up and begins trading just at the upper trend line and then continues upward.
* August 24th was called a flash crash by all the non-trading experts. Lots of talking heads said it was the end of the world and the beginning of the “big one.” Most who have been around a while know it was just a lack of liquidity – not enough buy orders to keep the price up. The “big one” is the volume of experts blowing smoke on television. Stick to the writers at StockCharts.com and you’ll get a much better picture.
 Chart A
I have mentioned before about trendlines other than the horizontal price-based ones. Believe me I used to draw them all over the chart; however, found that they only worked in perfect 20 – 20 hindsight. When you connect 3-4 low pricess over a few years and they line up perfectly, remember that the only other ones that see it are technical analysts, most of which don’t ever trade. And they certainly never move the market if they do trade. Tirade over!
Dance with the Trend,
Greg Morris
