 Di-ver-si-fi-ca-tion
1. the act or process of diversifying; state of being diversified.
2. the act or practice of manufacturing a variety of products, investing in a variety of securities, selling a variety of merchandise, etc., so that a failure in or an economic slump affecting one of them will not be disastrous.
Relying on Webster doesn’t provide much help to investors wanting to learn about diversification. Diversification is a free lunch! I do not know who said that, but I certainly agree with it. However, let me expound on some misunderstandings regarding diversification and a related concept known as multicollinearity. Chart A (Diversification Works) and Chart B (Until it Doesn’t) speak for themselves and I have shown similar ones a few times before, but the message is always strong.
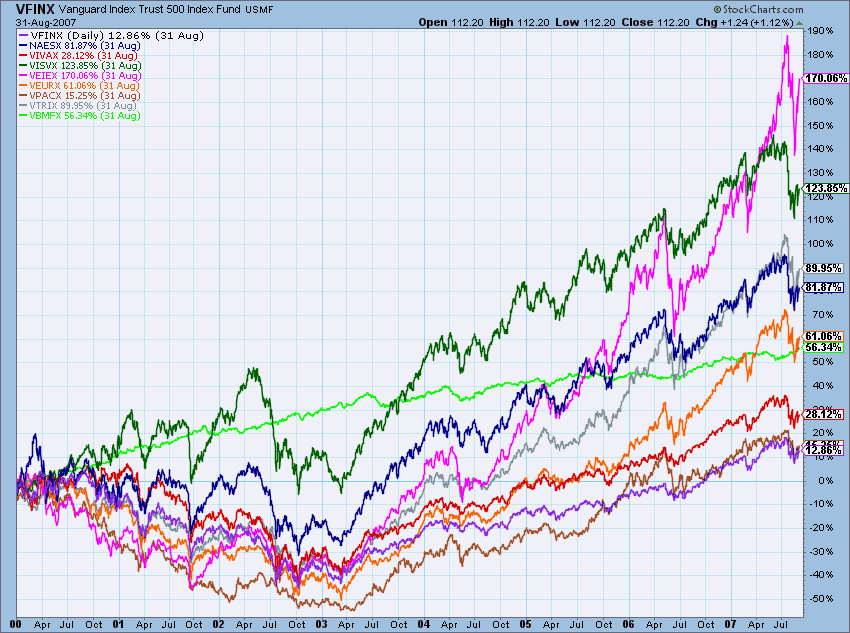 Chart A - Diversification WORKS
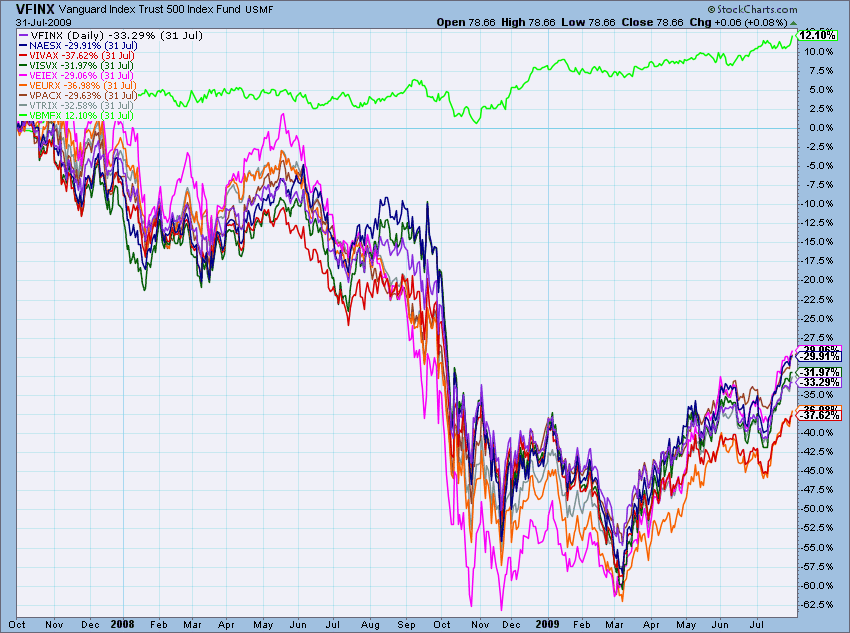 Chart B - Diversification does NOT work
The saying goes that during severe bear markets all correlations move rapidly toward 1. As a quick review, a correlation of 1 means correlated, -1 means inversely correlated, and 0 means not correlated. And of course there are variations between 1 and -1 to reflect the degree of correlation. The period from Oct, 2007 to Mar, 2009 (Chart B) was a severe bear market. Whereas in Chart A you can see that the end of the dot com era wasn’t as severe and various assets performed differently. This is because during the period 1998-2000, about the only thing rising was large cap growth (dot.com). Most small cap and breadth were in decline those years. In other words, the bear market for many assets started much earlier than what the indices showed.
What is diversification? Many believe it means holding a bunch of different stocks. That is NOT what it means but sadly that is all many believe it to be. Diversification means your portfolio consists of non-correlated issues. In finance and investing, diversification is the process of allocating capital in a way that reduces the exposure to any particular asset class. A common path towards diversification is to reduce risk or volatility by investing in a variety of assets. One can also diversify across various levels of risk.
Mul-ti-coll-in-e-at-ity
A phenomenon in which two or more predictor variables in a multiple regression model are highly correlated, so that the coefficient estimates may change erratically in response to small changes in the model or data. Again, Webster doesn’t help much.
Multicollinearity is similar to diversification. Multicollinearity is a statistical term for a problem that is common in technical analysis. That is, when one unknowingly uses the same type of information more than once. Analysts need to be careful and not utilize technical indicators that reveal the same type of information.
Here is how John Bollinger states it: “A cardinal rule for the successful use of technical analysis requires avoiding multicollinearity amid indicators. Multicollinearity is simply the multiple counting of the same information. The use of four different indicators all derived from the same series of closing prices to confirm each other is a perfect example.”
The issue of multicollinearity is a serious issue in technical analysis when your money is at stake. It is a problem because collinear variables contribute redundant information and can cause other variables to appear to be less important than they really are. One of the real problems is that sometimes multicollinearity is difficult to spot.
Technical indicators should be arranged in categories to keep from using too many from the same category. Here is a table that categorizes the indicators available at StockCharts.com’s ChartSchool:
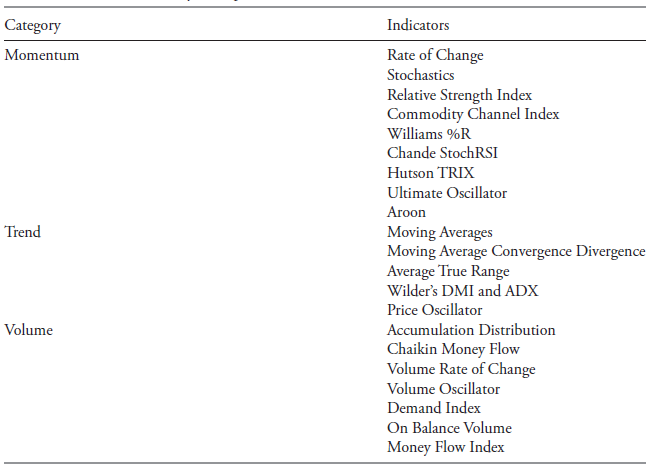 Table A
If you are randomly selecting indicators to support your analysis, you will more than likely fall into the multicollinearity trap of using multiple indicators that are all saying the same thing. They are not giving you any additional information; in fact, they are restricting your overall view of the market. Don't search for supporting information among collinear indicators, it is just misleading. Leave that up to the television experts.
If you find a group of indicators that are essentially telling you the same thing and with consistency, you need to pick one of them to use and then drop the others. If they are all saying the same thing they are not assisting you in your analysis. This is known as multicollinearity and is a trap you need to avoid. Ensure that you are using indicators that measure the markets differently, and are diversified. While breadth indicators are different than most price-based indicators, there are many price and breadth indicators that are essentially revealing the same thing.
Many times, investors think that they are more correct in their analysis if many indicators are telling them the same thing (see article on confirmation bias). They are supportive of your analysis only if the indicators are not collinear. If they are collinear, then the support the investor feels from having a lot of indications agree is misleading and dangerous. The support for their analysis gives them a false confidence. This occurs in many things, more information is not always better information.
Hopefully you see that diversification and its cousin, multicollinearity, have some things in common. Understanding both are necessary in technical analysis. As an aside, I was going to title this article Syllables, but decided not to at last minute. Think about it.
Dance with the Trend,
Greg Morris
