 There are 10 types of people in this world, those who understand binary and those who do not. Yes, the title is binary for 20,000. I knew the title of this article would get your attention. The financial media is possessed with round numbers more than I can remember. Back in the 70s, the Dow Industrials bounced off (resistance) of 1000 many times and it was 1983 (10+ years) before it finally broke through on the upside like a homesick angel. I’m not sure but I think intraday in 1966 it bumped up against 1000 also, but did not close there. In the past few months if you listen to the experts and talking heads, you would think approaching and crossing 20,000 on the Dow Industrials was the only newsworthy thing to talk about. Most, who actually trade, don’t think a thing about it.
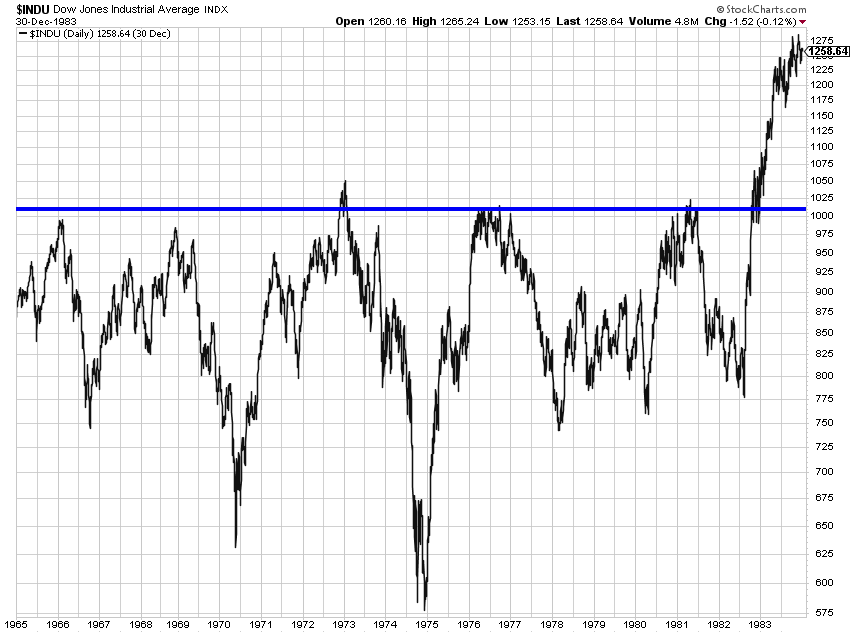 Chart A
I have also stated often that when you draw trendlines you should stick to horizontal ones because they are based on price which sort of removes the subjectivity. Plus, when drawing them on long periods of data, be sure to draw them really thick, maybe even an expanding cone to the right. See my article of Nov. 24, 2014 On Trendlines. This is not science; this is an art.
Bespoke published something similar to the following table of statistics. I thought it was interesting but need to remind you that statistics are observable information in that they ONLY help you understand the past. You cannot make a valid investment / trading decision from them. They are not actionable. See article on Information: Actionable or Observable.
 Table A
In Table A it is interesting that it took a little over 22 years to go from 1000 to 4000 or a 300% move (8136 days). And it took a little over 22 years to again go up 400% from 4000 to 20,000 (8007 days). The other thing I find interesting is that the ones who first published this data measured the # Days Since Prior Crossing in calendar days instead of market days. There are 365.25 days in a year and normally 252 market days in a year. However, the percentages and times would still be the same. Four times the market moved through a 1000 level and crisscrossed that level less than 10 times; 4000, 5000, 6000, and 19000. The first three of those were during an exceptional bull market. See Chart B.
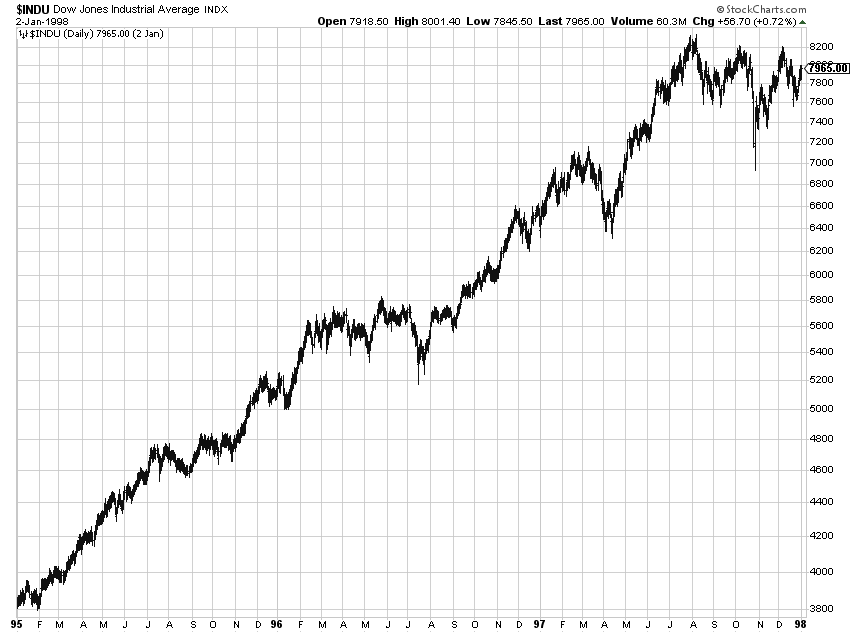 Chart B
This article is only about observable information; you cannot make a trading decision with this information. There are 10 types of people in this world, those who understand binary and those who do not. Just in case – 10 in binary is 2 in decimal.
Dance with the Trend,
Greg Morris
