 The first thing you must realize is that you won’t know it is peaking until the decline is well underway. Market tops are extremely difficult to identify. That might seem hard to believe if you watch the financial media as those 'experts' are calling the top multiple times a day; like they have been doing for years. And yes, they keep getting invited back. With the art of hindsight, I have charted the past two bear market tops. We can refer to them as bear market tops now, but back then you could not. In Chart A, the March 2000 top is shown with data nine months before and after the top. Looks sort of volatile, doesn’t it? Periods of distribution usually are. We call these periods of distribution because stocks are distributed from strong hands to weak hands. A trend follower often starts to question his/her methods during these periods as the whipsaws can mount. I also show the eventual bear market level, accepting the ubiquitous 20% decline as the definition. If you recall, the 2000-2002 bear eventually dropped 50.5%. If you are not a trend follower, I have this question: At what stage did you get out
of the market? Was it based on portfolio drawdown, stops, fear, all the above? You need to think this through now; not during the topping process.
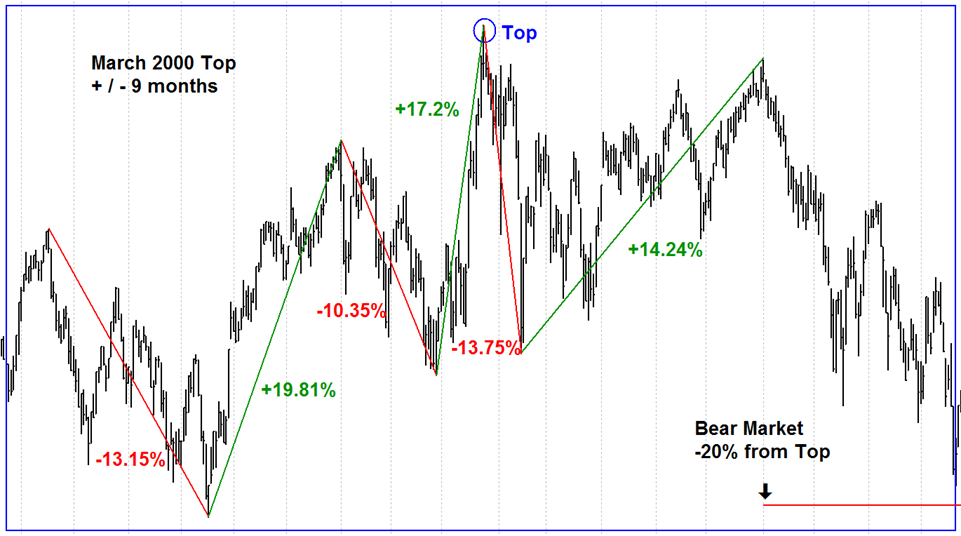 Chart A
Chart B shows the 2007 bear market top, again with data 9 months before and after. I think you can see that this period of distribution wasn’t quite as volatile. In fact, short to medium trend following worked fairly well. The eventual decline of the 2007-2009 bear was 57.69%.
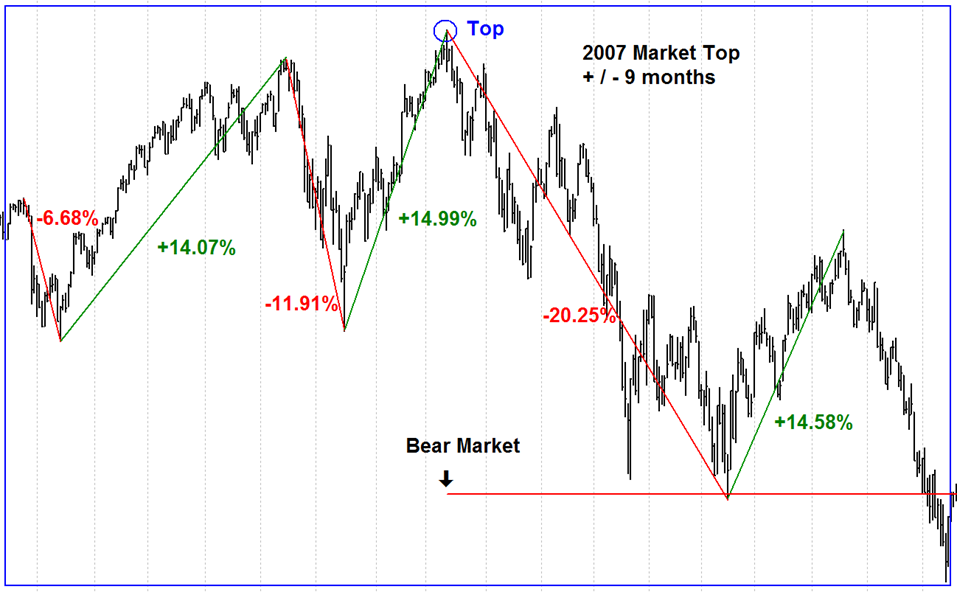 Chart B
These two bear markets were very different in their makeup and execution. The 2000-2002 bear actually began in 1998 if you looked at anything other than cap-weighted indices. Small caps, Mid caps, and breadth dropped significantly in 1999. Only the Large Cap growth stocks continued to rise driving the averages higher. Recall it was the end of the dot.com jubilation era. The 2007-2009 bear was a full-fledged bear where almost everything declined. Correlations approached 1 for almost all styles, sectors, and industry groups. That did not happen in the earlier bear market.
I guess the message here is that it is quite probable that most people will not realize they are in a bear until they are well into it. And then they are fighting their emotions thinking it is too late to sell. This is one of the reasons I became a trend follower a few decades ago; it will eventually take care of you even though the ride might be bumpy. Finally, I did not identify the market average I used in these charts so hopefully you will look them up and study them closer. It will pay off when the next bear arrives; and it will arrive.
Dance with the Trend,
Greg Morris
