 There are a number of companies that track performance for various asset classes, including the performance of investors. Table A, from J.P. Morgan, shows the Average Investor’s 20-year annualized returns of only 2.3%. I have reproduced the small print below the table because it explains the process used. And I cannot read the small print.
Source: J.P. Morgan Asset Management; (Top) Barclays, FactSet, Standard & Poor’s; (Bottom) Dalbar Inc.
Indexes used are as follows: REITS: NAREIT Equity REIT Index, EAFE: MSCI EAFE, Oil: WTI Index, Bonds: Barclays U.S. Aggregate Index, Homes: median sale price of existing single-family homes, Gold: USD/troy oz, Inflation: CPI. 60/40: A balanced portfolio with 60% invested in S&P 500 Index and 40% invested in high quality U.S. fixed income, represented by the Barclays U.S. Aggregate Index. The portfolio is rebalanced annually. Average asset allocation investor return is based on an analysis by Dalbar Inc., which utilizes the net of aggregate mutual fund sales, redemptions and exchanges each month as a measure of investor behavior. Returns are annualized (and total return where applicable) and represent the 20-year period ending 12/31/16 to match Dalbar’s most recent analysis.
Guide to the Markets – U.S. Data are as of September 30, 2017.
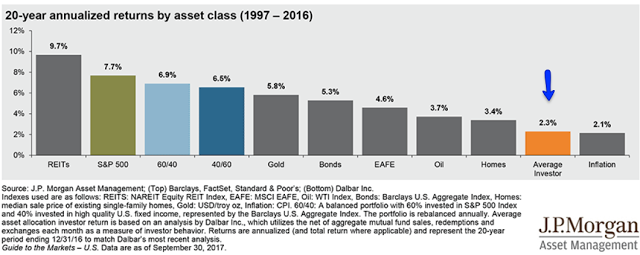 Table A
To further show how poorly the average investor does, Table B compares various time periods of investor returns versus the markets. Keep something in mind, when looking at average returns of investors, the process could very well be flawed. It is impossible to know the returns of all investors; and probably impossible to know how many investors there are. Most of this data is generated by ICI, the Investment Company Institute which is the Mutual Fund tracking company.
Here’s something funny about average. If you ask a large group where they stand relative to average; 75% will say they are above average. I’m planning a future article on the deception of average.
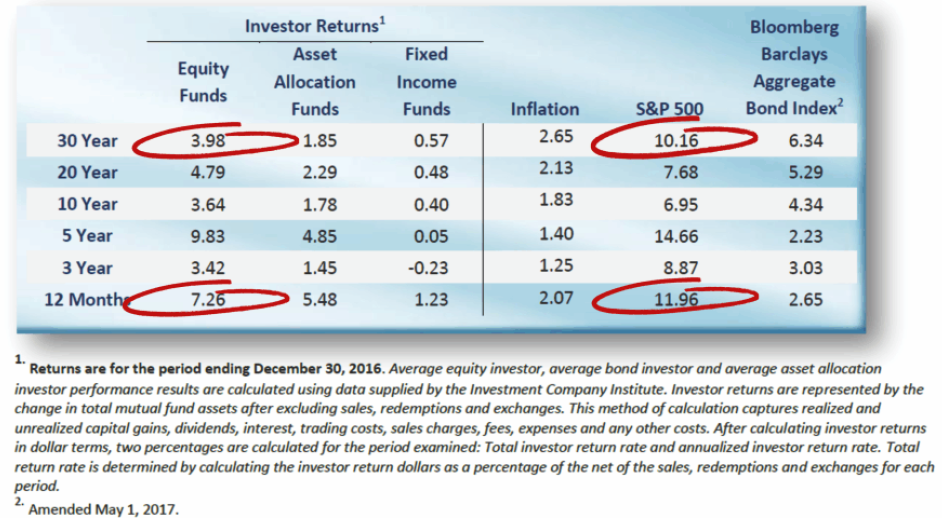 Table B
My friend, Lance Roberts let me steal the below chart from him. It shows that investors over all time periods underperform.
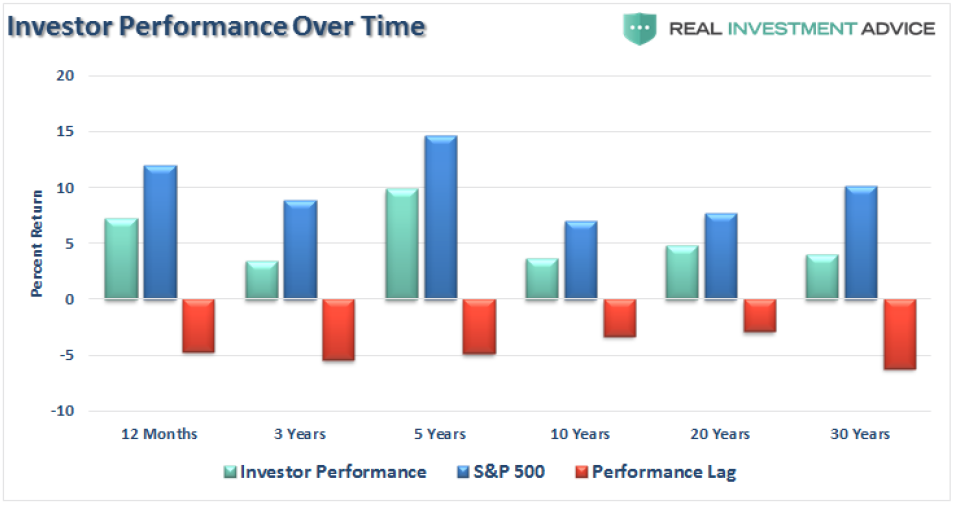 Table C
So hopefully at this point you will accept that the average investor does not do a good job at investing; keeping in mind that StockCharts.com subscribers are not average. Why do investors as a whole perform so poorly? Of course, no one really knows, but my guess is that the average investor let’s his/her emotions get involved in the decision making and they do not follow a process. I have written a number of articles called “Know Thyself,” which highlight all the various investor frailties that work against them. I have also often written about following a model (process).
Another issue that is probably common with the below average investor is chasing performance by moving from one hot fund/strategy to the next. I’ve always said those Morningstar Star rankings should be a hint as to where not to be invested. Top performers rarely stay there; you want to find a strategy that makes you comfortable. A good list of stocks to buy is published every day in almost all newspapers; it is called the 52-week New Highs. These stocks have proven they can go up, so why not get onboard one of them? And that brings up another investor frailty; thinking that a stock on that list has already gone up and won’t continue. That’s the very foolishness that keeps them below average.
True Confession! I used to be a horrible investor. I read earnings reports, subscribed to newsletters, did all the usual stuff an uninformed investor would think is the correct thing to do. After many years of being a horrible investor and finally relying on technical analysis instead of all that nonsense, things improved. For the past 20 years I have relied solely upon a rules-based trend following model. And follow it religiously. That alone eliminates all the emotions and poor decisions. And you can play a lot of golf.
I do believe that if you are reading blogs on StockCharts.com and are a subscriber to StockCharts.com you are probably in the above average camp; congratulations!
Dance with the Trend,
Greg Morris
