 Another price-based measure I use in my weight of the evidence is called Adaptive Trend. This was modeled after an indicator from the Bloomberg service called Trender. Adaptive Trend identifies price swings based on the daily trading range. It uses Average True Range (ATR), exponential smoothing, and standard deviation as inputs. The resulting indicator is a trend-following approach not unlike some Parabolic Studies. In an uptrend, a support line will appear below the price. A sell signal is generated when price closes below the support line. In a downtrend, a resistance line will appear above the price. A buy signal is generated when price closes above the resistance line.
Adaptive trend calculates the exponential average of the midpoint and the exponential average of the true range. it then adds (or subtracts) half of the true range average to the midpoint average. This is the adjusted midpoint. Next, Adaptive Trend calculates X standard deviation of the true range average and adds to (or subtracts) that value from the adjusted midpoint (if your sensitivity is 1). The "Sensitivity" option is designed to increase the number of standard deviations used to add to (subtract from) the adjusted midpoint. Finally, Adaptive Trend can be plotted on the chart., price must close above or below the Adaptive Trend line for a buy/sell signal to occur. This behavior resembles a trailing stop so the gain in a directional move is not given back with a reversal in trend.
In Chart A I have shown all the variations of displaying adaptive trend. The black line in the top plot is the Nasdaq Composite, the red dotted line is the Adaptive Trend. Notice how it hugs the data and at some point; swaps from being a support line to a resistance line. These are simply the buy and sell signals. When the red dotted line is below the price you are invested and when it is above you are not. Of course, I can also show just the digital signal as shown by the blue line in both the upper and lower plots. The bottom plot indexes the adaptive trend into an oscillator. The black line is the Nasdaq Composite and its relative movement about the adaptive trend as shown by the horizontal red line.
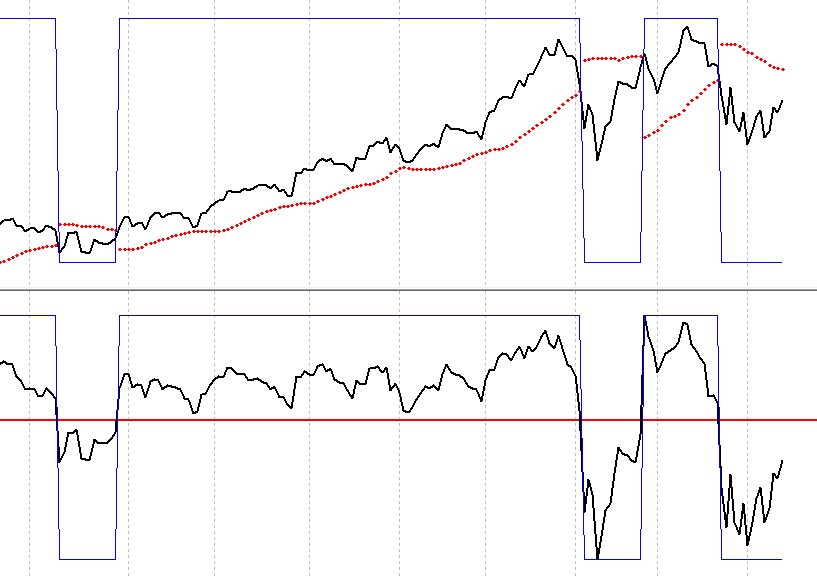 Chart A
A little history on the adaptive trend follows. It was not part of the original model but was used to replace an indicator involving long-term interest rates that had steadily become less effective at trend following. Decades ago long-term interest rates and the stock market had a fair negative correlation. You might recall that Martin Zweig had coined a term called “three steps and a stumble.” This referred to the discount rate rising three times and then the stock market would fall. The relationship between interest rates and the stock market takes a wide jaundiced eye to see now so that interest rate measure was replaced with adaptive trend. Adaptive measures were rare in the “old days,” but seem to be everywhere now. When I was traveling I was always asked by the experienced advisors if we ever tweaked our model. The response was yes, one time, and you just read about it. Tweaking a model is a bad thing to do on a routine basis. Finally, you can search for "Trender" and find a number of articles written about it to further help you understand it.
Dance with the Trend,
Greg Morris
