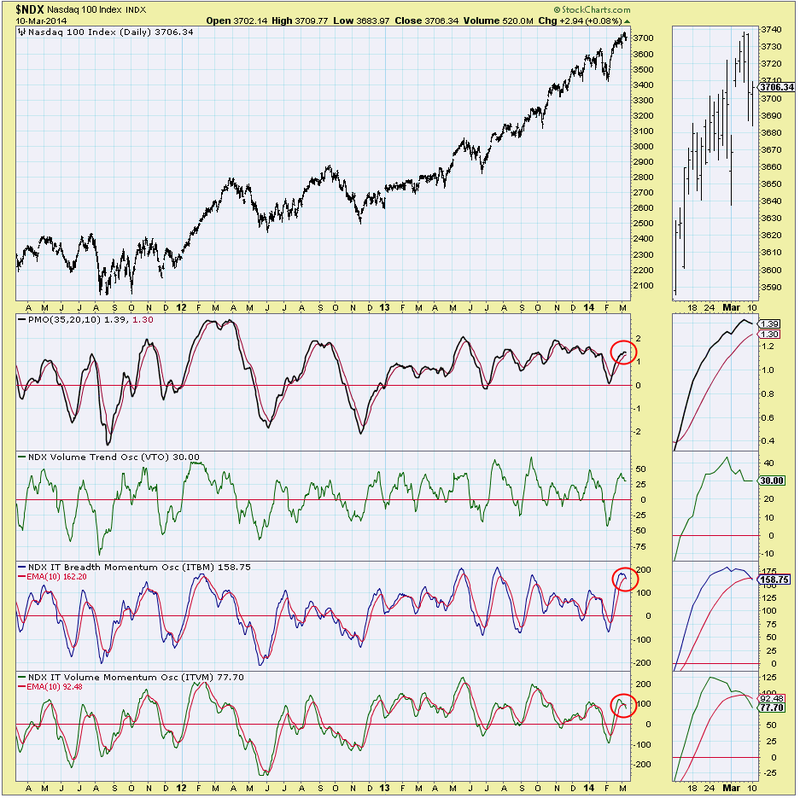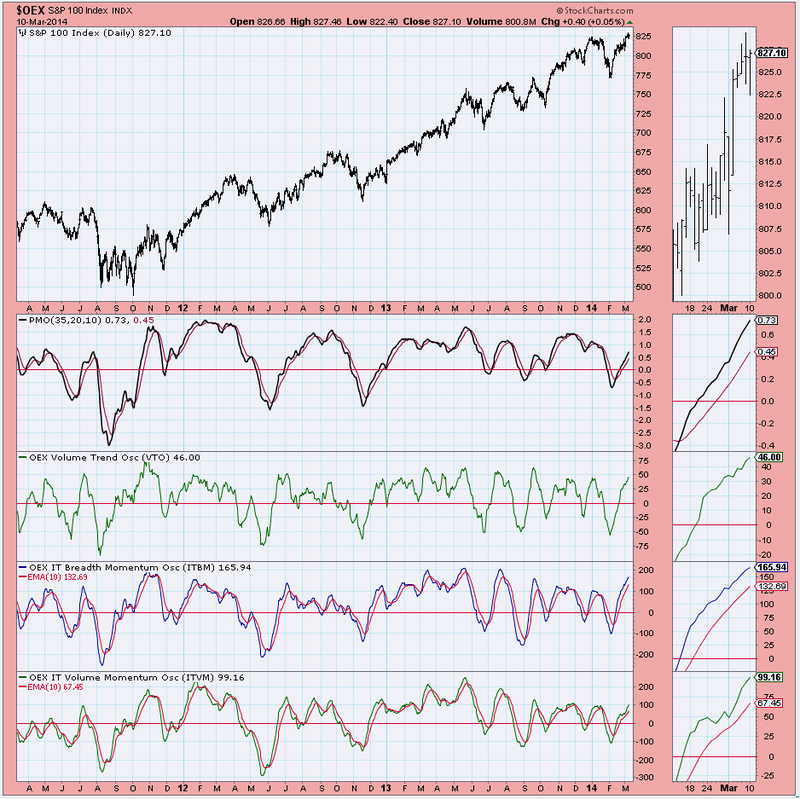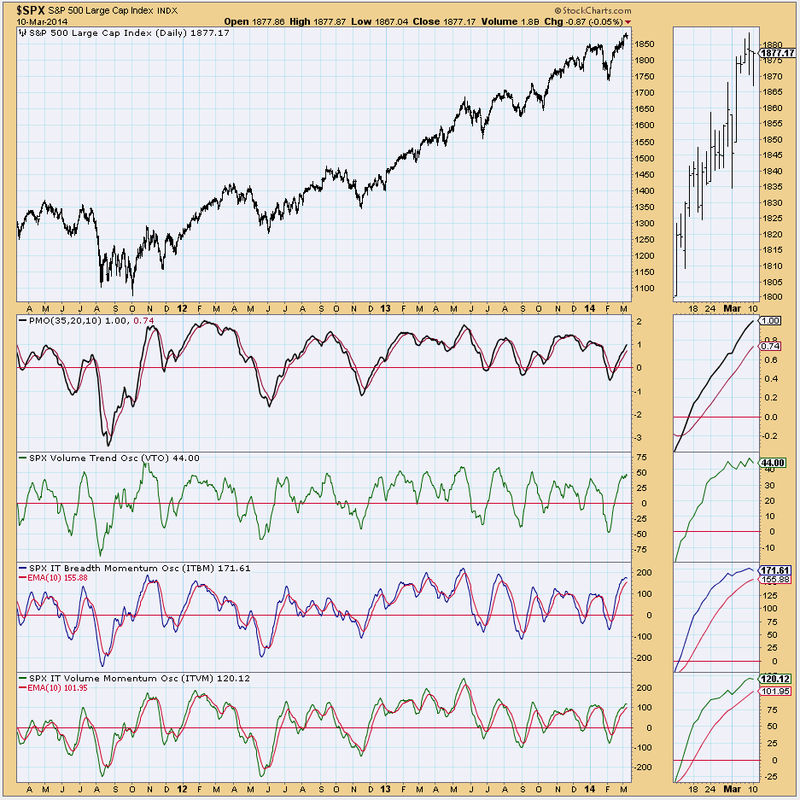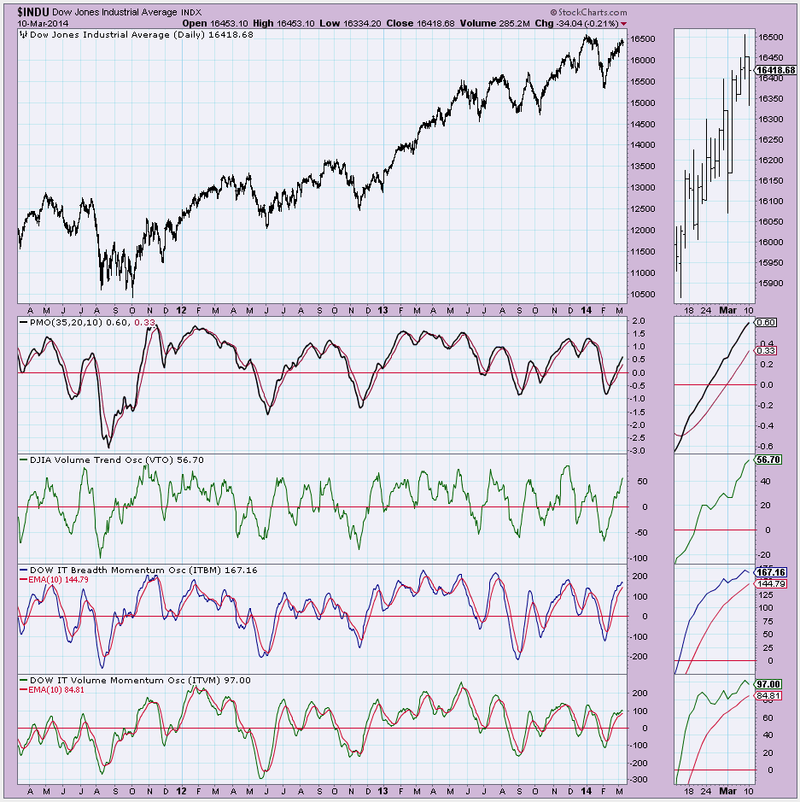
While the other major indexes in the DP Chart Gallery (SPX, OEX and DJIA) continue to show positive momentum with rising Price Momentum Oscillator (PMO) readings, I noticed the Nasdaq 100 intermediate-term indicators including the PMO reveal weakness.
In the chart below note that the PMO has topped and both the ITBM and ITVM had negative crossovers today. All of these factors are indicative of a loss of momentum and internal weakness.
If you look at the same chart for the other three indexes in the DP Chart Gallery, you will see marked differences. In the case of the OEX, the PMO, ITBM and ITVM are all still rising.
In the case of the SPX and DJIA, the PMO continues to rise strongly, but the ITBM and ITVM have topped. Topping in the ITVM and ITBM is not good, but they have some distance to cover before a negative crossover their EMAs will occur.
We will sometimes see one index lead the way, not only in a positive direction but also in negative direction. In this case, the NDX intermediate-term indicators could be sending up a flare that markets in general are weakening and prepping for a possible pullback.
Happy Charting,
Erin


