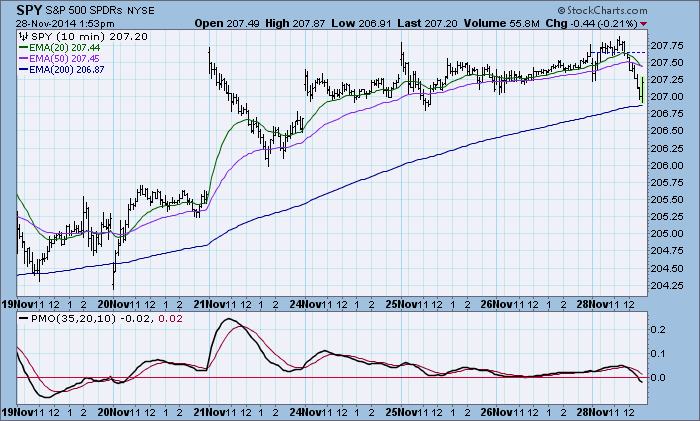
The market closed slightly lower but it remained within the narrow range of the previous four trading days.
The purpose of the DecisionPoint Daily Update is to quickly review the day's action, internal condition, and Trend Model status of the broad market (S&P 500), the nine SPDR Sectors, the U.S. Dollar, Gold, Crude Oil, and Bonds. To ensure that using this daily reference will be quick and painless, we are as brief as possible, and often we let a chart speak for itself.
SIGNALS: Here we include the current day's signal table, an excerpt from the DecisionPoint Alert Daily Report.
DECISIONPOINT ALERT DAILY REPORT
Friday, 11/28/2014

************************ DECISIONPOINT MARKET POSTURE ***********************

The following is the market posture suggested by our mechanical trend-
following tools. These are not trading recommendations, rather they are price
activity flags that should be qualified by chart analysis. The Trend Model is
used on all indexes.


                                     Days   Index     11/28   Points  Percent
Index               Posture     Date Elap  @Start     Close      P/L      P/L
------------------- ------- -------- ---- -------   -------  -------  -------
Stocks Medium-Term  Bullish 10/31/14   28   201.66   207.20    +5.54    +2.7%
Stocks Long-Term    Bullish 10/31/14   28   201.66   207.20    +5.54    +2.7%
Gold (NY Spot)      Bearish 08/21/14   99  1275.40  1175.50   +99.90    +7.8%
20+Yr T-Bond  (TLT) Bullish 01/17/14  315   102.88   122.49   +19.61   +19.1%
------------------- ------- -------- ---- -------   -------  -------  -------
Dollar Index  (UUP) Bullish 07/21/14  130    21.47    23.47    +2.00    +9.3%
Commodities   (GSG) Neutral 07/14/14  137    32.64    25.02     ....     ....
Crude Oil     (USO) Neutral 07/30/14  121    36.92    25.58     ....     ....
------------------- ------- -------- ---- -------   -------  -------  -------
S&P 500       (SPY)     BUY 10/31/14   28   201.66   207.20    +5.54    +2.7%
S&P Equal Wt  (RSP)     BUY 11/03/14   25    78.10    80.16    +2.06    +2.6%
Dow           (DIA)     BUY 10/31/14   28   173.01   178.10    +5.09    +2.9%
Nasdaq 100    (QQQ)     BUY 10/29/14   30    99.81   106.01    +6.20    +6.2%
NDX Equal Wt (QQEW)     BUY 10/30/14   29    40.66    43.35    +2.69    +6.6%
S&P 100       (OEF)     BUY 10/31/14   28    89.75    92.04    +2.29    +2.6%
S&P 400 MidCp (IJH)     BUY 11/05/14   23   141.76   144.26    +2.50    +1.8%
S&P 600 SmlCp (IJR)     BUY 11/03/14   25   111.40   111.30    -0.10    -0.1%
Total Market  (VTI)     BUY 11/03/14   25   104.08   106.60    +2.52    +2.4%
Consumer Disc (XLY)     BUY 11/05/14   23    67.55    71.81    +4.26    +6.3%
Cons Disc EWt (RCD)     BUY 11/03/14   25    82.86    87.60    +4.74    +5.7%
Consumer Stpl (XLP)     BUY 08/20/14  100    44.59    49.30    +4.71   +10.6%
Cons Stpl EWt (RHS)     BUY 10/21/14   38    98.15   105.62    +7.47    +7.6%
Energy        (XLE) Neutral 09/08/14   81    95.08    79.82     ....     ....
Energy EWt    (RYE) Neutral 09/08/14   81    87.04    69.74     ....     ....
Financial     (XLF)     BUY 10/29/14   30    23.44    24.40    +0.96    +4.1%
Financial EWt (RYF)     BUY 10/30/14   29    42.64    44.19    +1.55    +3.6%
Health Care   (XLV)     BUY 10/23/14   36    64.31    69.61    +5.30    +8.2%
Health Cr EWt (RYH)     BUY 05/09/14  203   115.95   143.12   +27.17   +23.4%
Industrial    (XLI)     BUY 10/30/14   29    54.67    56.91    +2.24    +4.1%
Industrl EWt  (RGI)     BUY 10/31/14   28    87.96    90.35    +2.39    +2.7%
Materials     (XLB)     BUY 11/18/14   10    49.87    49.16    -0.71    -1.4%
Materials EWt (RTM)     BUY 11/17/14   11    84.00    84.65    +0.65    +0.8%
Technology    (XLK)     BUY 10/31/14   28    40.54    42.49    +1.95    +4.8%
Technolgy EWt (RYT)     BUY 11/04/14   24    87.51    91.52    +4.01    +4.6%
Utilities     (XLU)     BUY 08/28/14   92    42.62    46.00    +3.38    +7.9%
Utilities EWt (RYU)     BUY 08/20/14  100    71.92    77.61    +5.69    +7.9%

Average                                45                               +5.1%
NOTE: Mechanical trading model signals define the implied bias of the price index based upon moving average relationships, but they do not necessarily call for a specific action. They are information flags that should prompt chart review. Further, they do not call for continuous buying or selling during the life of the signal. For example, a BUY signal will probably return the best results if action is taken soon after the signal is generated. Additional opportunities for buying may be found as price zigzags higher, but the trader must look for optimum entry points. Conversely, exit points to preserve gains (or minimize losses) may be evident before the model mechanically closes the signal.
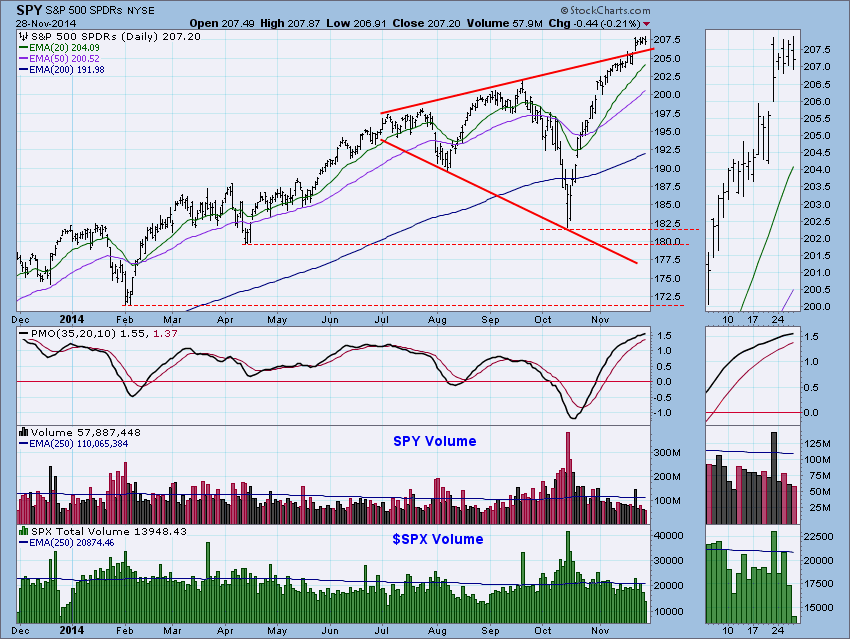
STOCKS: Based upon a 10/31/2014 Trend Model BUY signal, our current intermediate-term market posture for the S&P 500 (SPY) is bullish. The Trend Model, which informs our long-term outlook, is on a BUY signal as of 10/31/2014 so our long-term posture is bullish.
Price continues to cluster above support. Looking at the thumbnail, one could make a case for a bullish flag formation. If this is a flag, the flag pole is about 3.75 which would put the minimum upside target at 211.75. The PMO is smoothing as it gets closer to the top of its range.
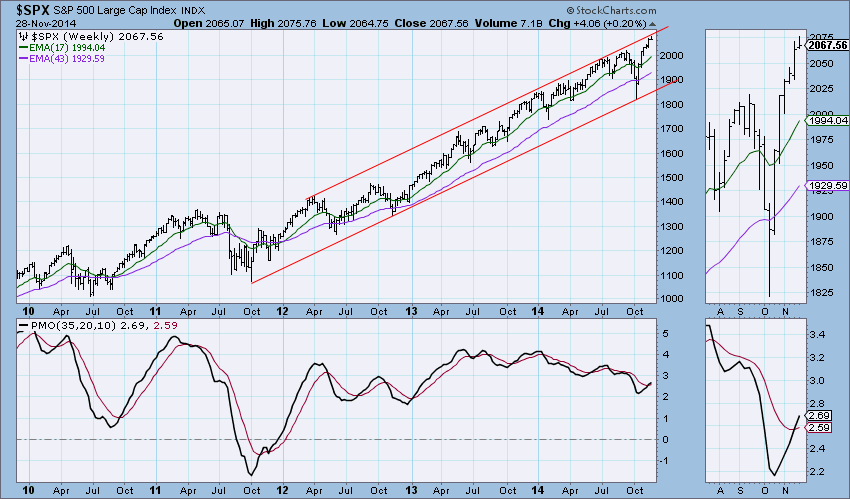
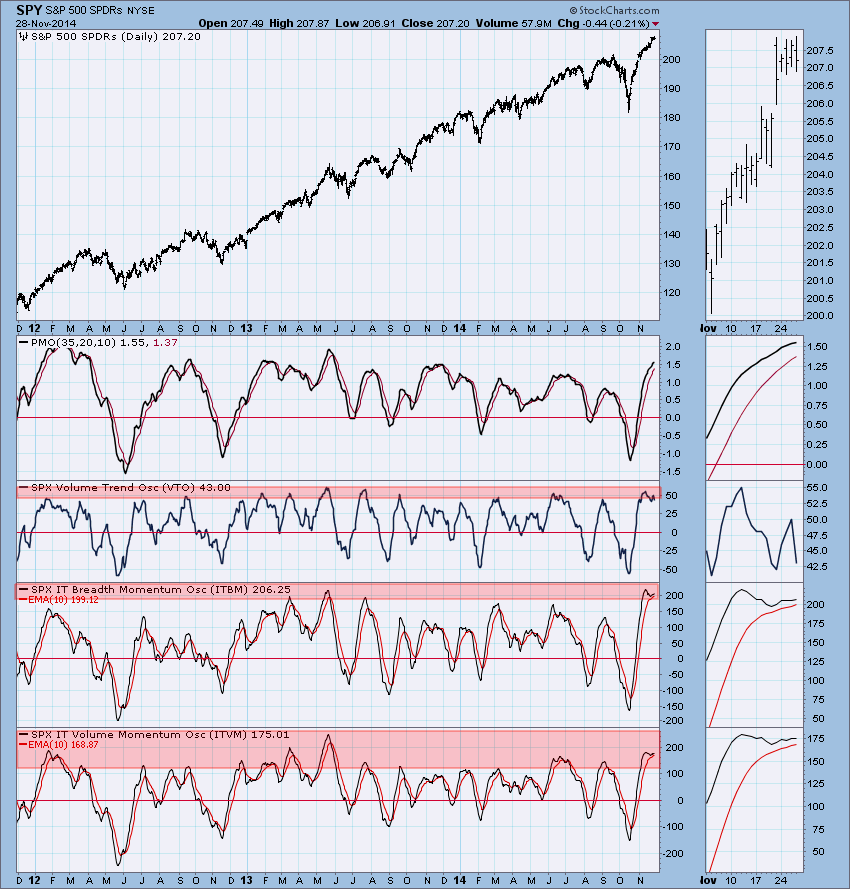
The weekly PMO is accelerating after having a positive crossover its EMA last week. Overhead resistance is holding.
Ultra-Short-Term Indicators: Definitely positive readings albeit not climactic. I'd rate this somewhat bullish to neutral.
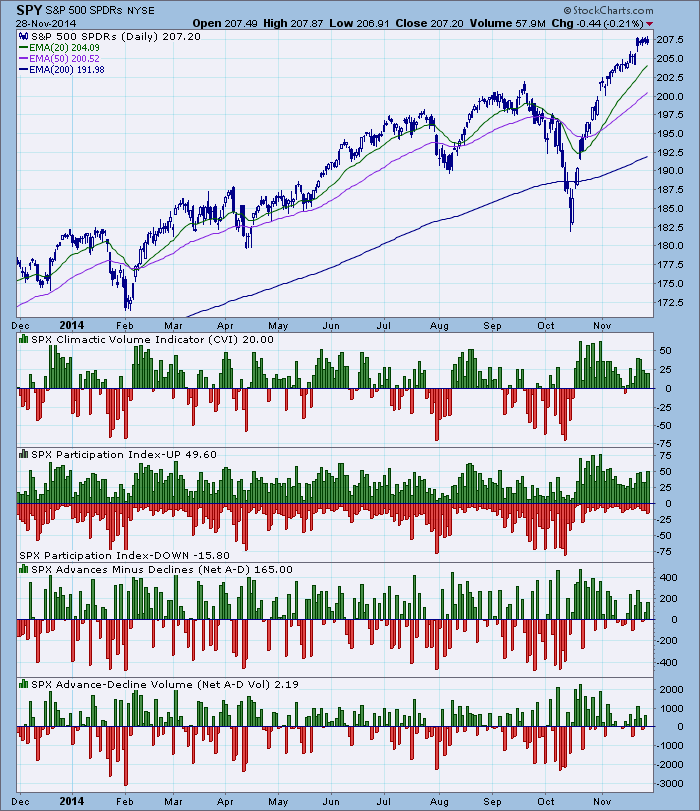
Short-Term Indicators: They finally broke from the declining trend they were in and have yet to get too overbought. All is very bullish in the short term.
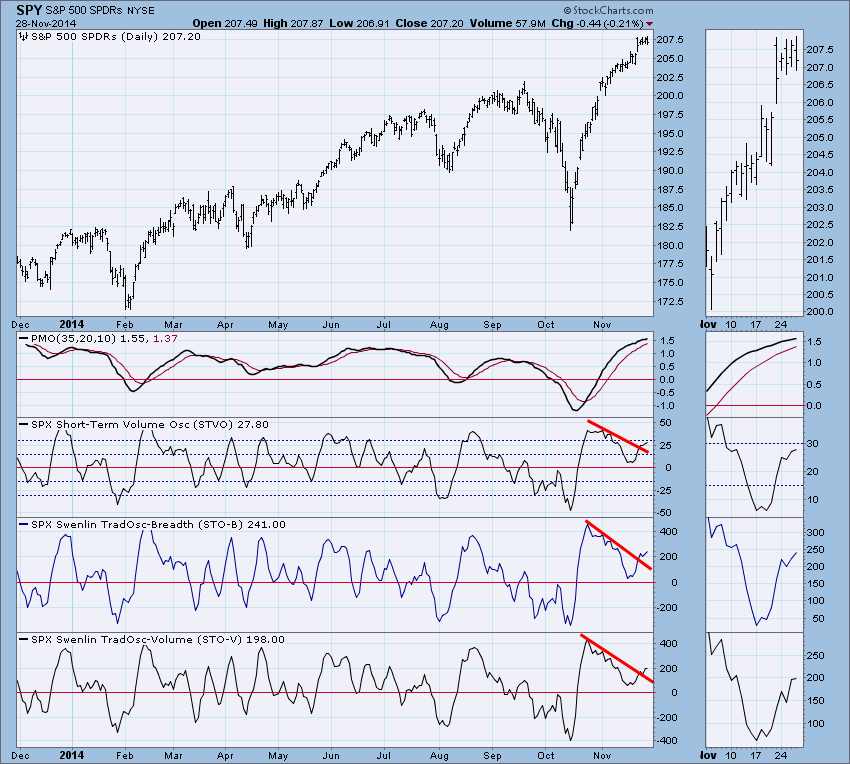
Intermediate-Term Indicators: They remain very overbought but have not succumbed to a negative crossover their EMAs. I would rate this as neutral to somewhat bearish.
Conclusion: It is hard to imagine a price rise to 211.75, as the bullish flag would suggest, when the market is so overbought. However, December is upon us and seasonally it tends to be bullish (hence the saying "Santa Claus Rally"). The short term looks bullish, but intermediate-term indicators can't remain in extremely overbought territory indefinitely. Carl suggested that we could see price continue somewhat higher through December but after the new year it could get ugly.
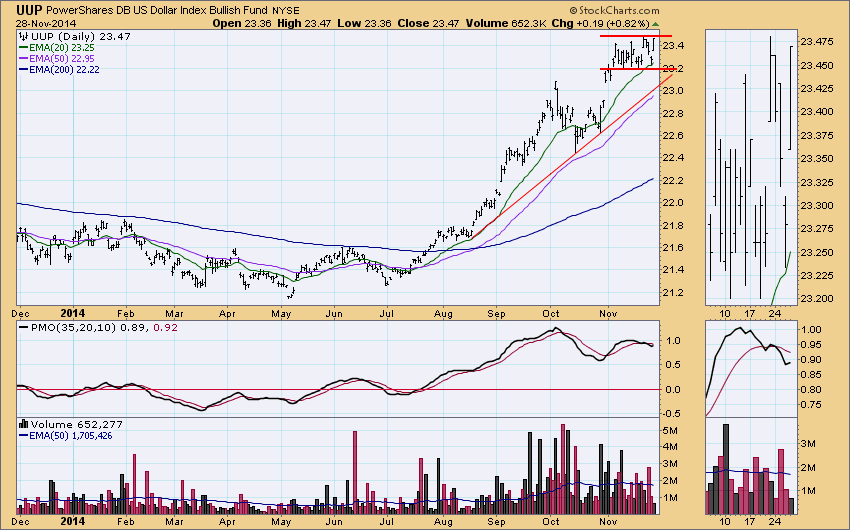
DOLLAR: As of 7/21/2014 the US Dollar Index ETF (UUP) is on a Trend Model BUY signal. The LT Trend Model, which informs our long-term outlook, is on a BUY signal as of 8/21/2014, so our long-term posture is bullish.
UUP is trying to break out of the November trading range.
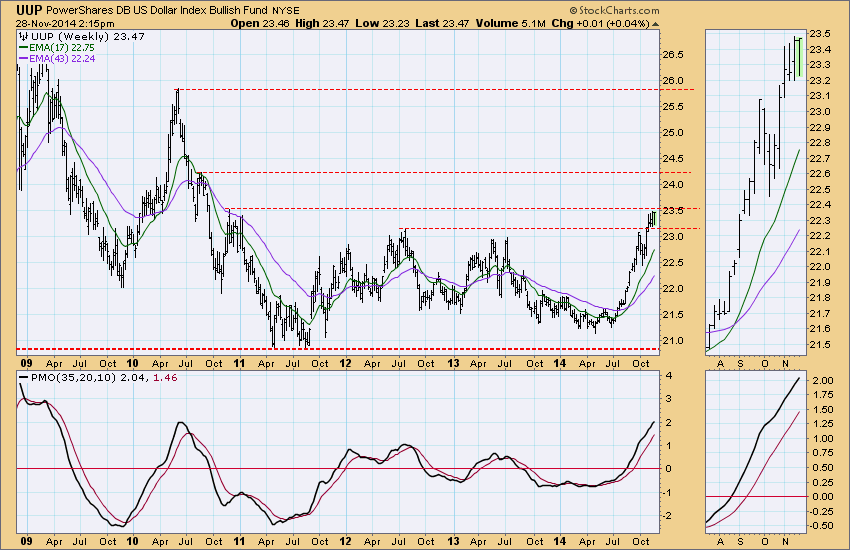
On the weekly chart we see that longer-term resistance has come into play.
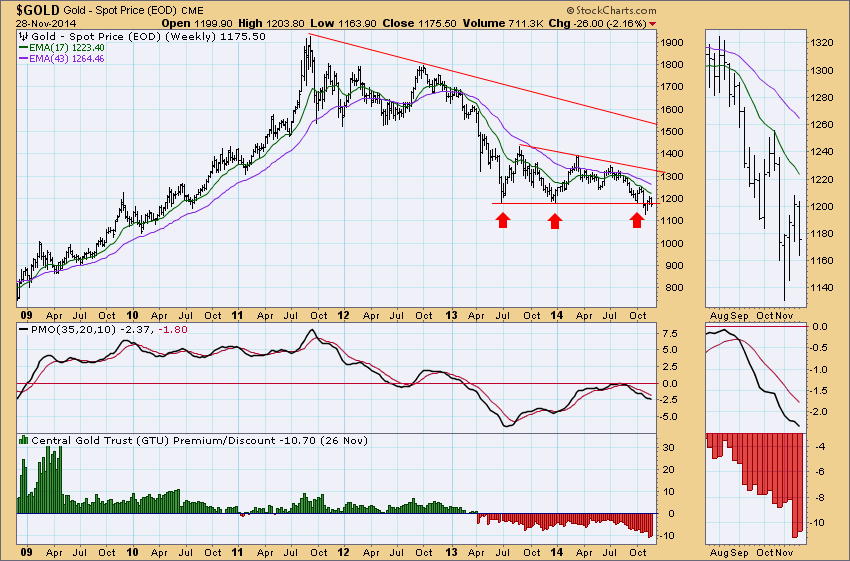
GOLD: As of 8/21/2014 Gold is on a Trend Model SELL signal. The LT Trend Model, which informs our long-term outlook, is on a SELL signal as of 2/15/2013, so our long-term posture is bearish.
Gold suffered quite a loss today. Intermediate-term support was significantly breached and the PMO topped at about the same place it did in October before price fell off a cliff.
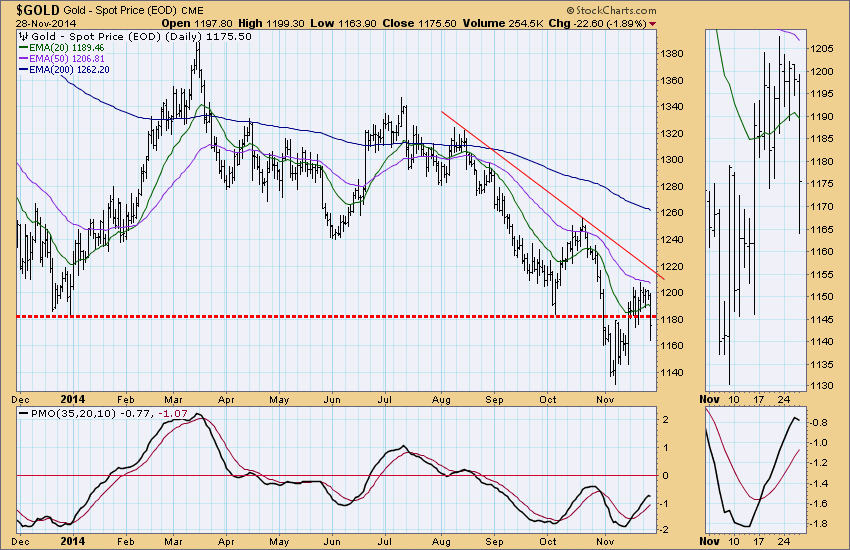
The third bottom still hasn't quite materialized and the PMO is far from being oversold. I suspect lower prices will continue to prevail.
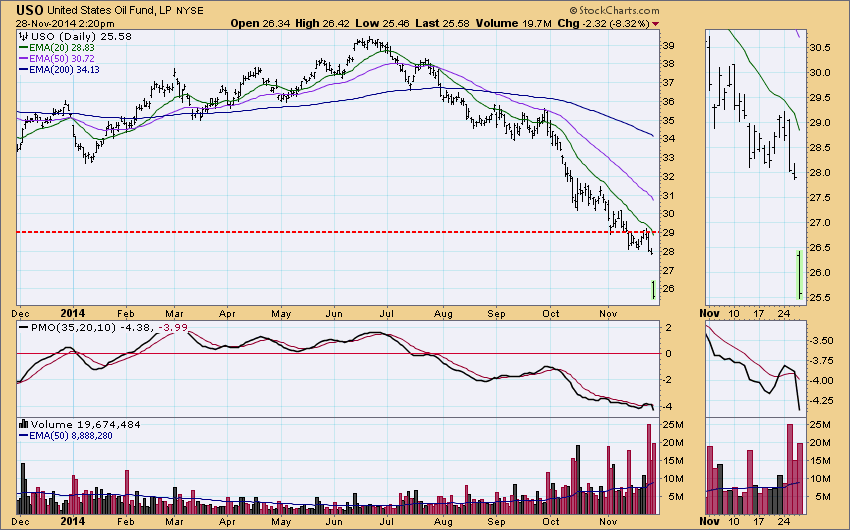
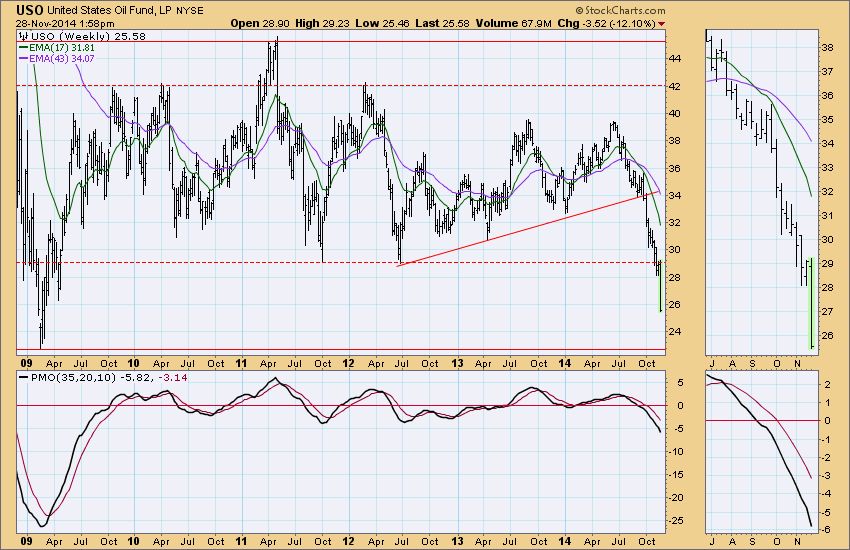
CRUDE OIL (USO): As of 7/30/2014 United States Oil Fund (USO) is on a Trend Model NEUTRAL signal. The LT Trend Model, which informs our long-term outlook, is on a SELL signal as of 8/28/2014, so our long-term posture is bearish.
Crude took a huge hit today with USO down -8.32%. The price per barrel is just under $66.00. The cause of the weakness is said to be soft demand rather than excess supply. The significance of this is that the world economy is sluggish.
The weekly chart shows that long-term support at 29.00 has been left far behind, and the next important support is at the 2009 low. Recall the reverse flag that executed on the daily chart had a minimum downside target of 24.50, this chart shows that real support will not be found until at least 23.
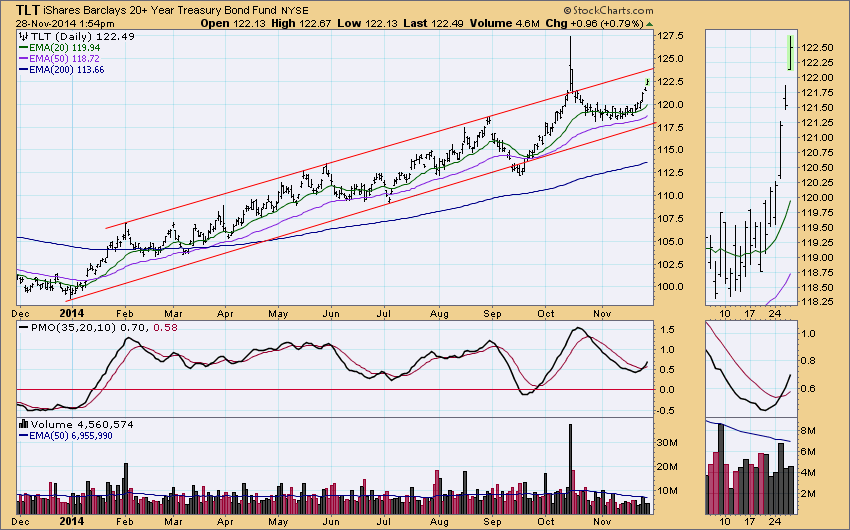
BONDS (TLT): As of 1/17/2014 The 20+ Year T-Bonds ETF (TLT) is on a Trend Model BUY signal. The LT Trend Model, which informs our long-term outlook, is on a BUY signal as of 3/24/2014, so our long-term posture is bullish.
TLT has moved above its one-month trading range.
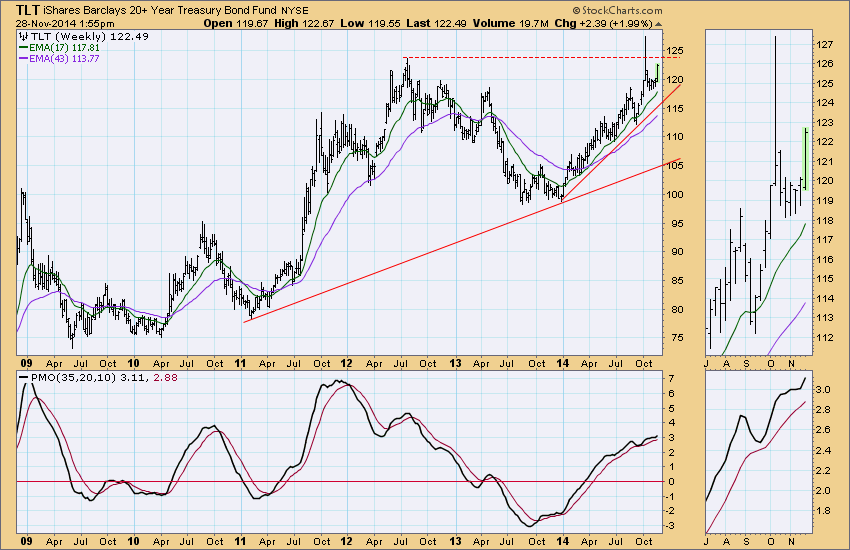
Longer-term we see that TLT is approaching resistance at the 2012 high.
Technical Analysis is a windsock, not a crystal ball.
- Carl
