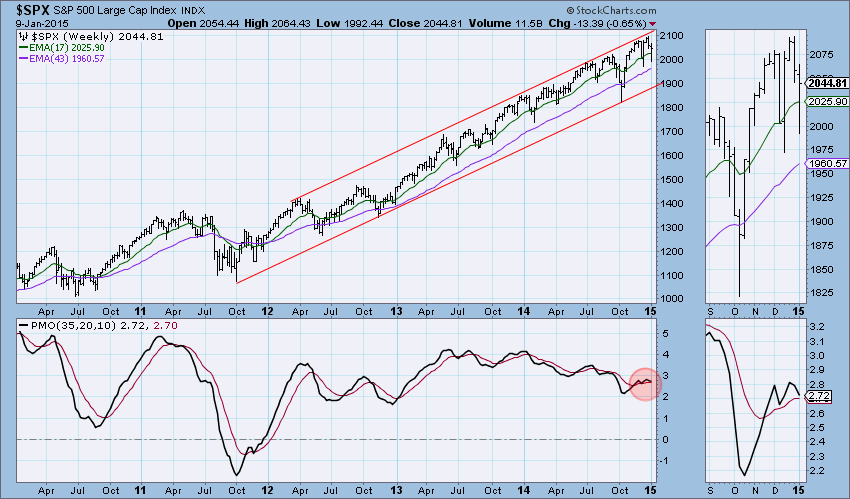
Here's the DecisionPoint weekly view of the current market situation. After the recent bounce, price took a break and backed off today.
The purpose of the DecisionPoint Daily Update is to quickly review the day's action, internal condition, and Trend Model status of the broad market (S&P 500), the nine SPDR Sectors, the U.S. Dollar, Gold, Crude Oil, and Bonds. To ensure that using this daily reference will be quick and painless, we are as brief as possible, and often we let a chart speak for itself.
SIGNALS: Here we include the current day's signal table, an excerpt from the DecisionPoint Alert Daily Report.
DECISIONPOINT ALERT DAILY REPORT
Friday, 1/9/2015

************************ DECISIONPOINT MARKET POSTURE ***********************

The following is the market posture suggested by our mechanical trend-
following tools. These are not trading recommendations, rather they are price
activity flags that should be qualified by chart analysis. The Trend Model is
used on all indexes.


                                     Days   Index     01/09   Points  Percent
Index               Posture     Date Elap  @Start     Close      P/L      P/L
------------------- ------- -------- ---- -------   -------  -------  -------
Stocks Medium-Term  Bullish 10/31/14   70   200.55   204.25    +3.70    +1.8%
Stocks Long-Term    Bullish 10/31/14   70   200.55   204.25    +3.70    +1.8%
Gold (NY Spot)      Bearish 08/21/14  141  1275.40  1216.10   +59.30    +4.6%
20+Yr T-Bond  (TLT) Bullish 01/17/14  357   102.43   131.07   +28.64   +28.0%
------------------- ------- -------- ---- -------   -------  -------  -------
Dollar Index  (UUP) Bullish 07/21/14  172    21.47    24.38    +2.91   +13.6%
Commodities   (GSG) Neutral 07/14/14  179    32.64    20.07     ....     ....
Crude Oil     (USO) Neutral 07/30/14  163    36.92    18.28     ....     ....
------------------- ------- -------- ---- -------   -------  -------  -------
S&P 500       (SPY)     BUY 10/31/14   70   200.55   204.25    +3.70    +1.8%
S&P Equal Wt  (RSP)     BUY 11/03/14   67    77.77    79.25    +1.48    +1.9%
Dow           (DIA)     BUY 10/31/14   70   172.64   177.22    +4.58    +2.7%
Nasdaq 100    (QQQ)     BUY 10/29/14   72    99.44   102.62    +3.18    +3.2%
NDX Equal Wt (QQEW)     BUY 10/30/14   71    40.52    42.37    +1.85    +4.6%
S&P 100       (OEF)     BUY 10/31/14   70    88.84    90.37    +1.53    +1.7%
S&P 400 MidCp (IJH)     BUY 11/05/14   65   141.11   143.72    +2.61    +1.8%
S&P 600 SmlCp (IJR)     BUY 11/03/14   67   110.95   111.61    +0.66    +0.6%
Total Market  (VTI)     BUY 11/03/14   67   103.53   105.27    +1.74    +1.7%
Consumer Disc (XLY)     BUY 11/05/14   65    67.27    70.89    +3.62    +5.4%
Cons Disc EWt (RCD)     BUY 11/03/14   67    82.65    87.07    +4.42    +5.3%
Consumer Stpl (XLP)     BUY 08/20/14  142    44.27    49.11    +4.84   +10.9%
Cons Stpl EWt (RHS)     BUY 10/21/14   80    97.79   105.80    +8.01    +8.2%
Energy        (XLE) Neutral 09/08/14  123    94.49    76.36     ....     ....
Energy EWt    (RYE) Neutral 09/08/14  123    86.56    64.05     ....     ....
Financial     (XLF)     BUY 10/29/14   72    23.32    24.12    +0.80    +3.4%
Financial EWt (RYF)     BUY 10/30/14   71    42.45    44.03    +1.58    +3.7%
Health Care   (XLV)     BUY 10/23/14   78    64.07    70.21    +6.14    +9.6%
Health Cr EWt (RYH)     BUY 05/09/14  245   115.84   145.88   +30.04   +25.9%
Industrial    (XLI)     BUY 10/30/14   71    54.37    55.42    +1.05    +1.9%
Industrl EWt  (RGI)     BUY 10/31/14   70    87.54    88.45    +0.91    +1.0%
Materials     (XLB) Neutral 01/06/15    3    46.99    48.40     ....     ....
Materials EWt (RTM)     BUY 12/22/14   18    83.94    83.96    +0.02    +0.0%
Technology    (XLK)     BUY 10/31/14   70    40.33    41.25    +0.92    +2.3%
Technolgy EWt (RYT)     BUY 11/04/14   66    87.04    90.26    +3.22    +3.7%
Utilities     (XLU)     BUY 08/28/14  134    42.24    47.38    +5.14   +12.2%
Utilities EWt (RYU)     BUY 08/20/14  142    71.41    78.37    +6.96    +9.7%

Average                                84                               +5.1%
NOTE: Mechanical trading model signals define the implied bias of the price index based upon moving average relationships, but they do not necessarily call for a specific action. They are information flags that should prompt chart review. Further, they do not call for continuous buying or selling during the life of the signal. For example, a BUY signal will probably return the best results if action is taken soon after the signal is generated. Additional opportunities for buying may be found as price zigzags higher, but the trader must look for optimum entry points. Conversely, exit points to preserve gains (or minimize losses) may be evident before the model mechanically closes the signal.
STOCKS: Based upon a 10/31/2014 Trend Model BUY signal, our current intermediate-term market posture for the S&P 500 (SPY) is bullish. The Trend Model, which informs our long-term outlook, is on a BUY signal as of 10/31/2014 so our long-term posture is bullish.
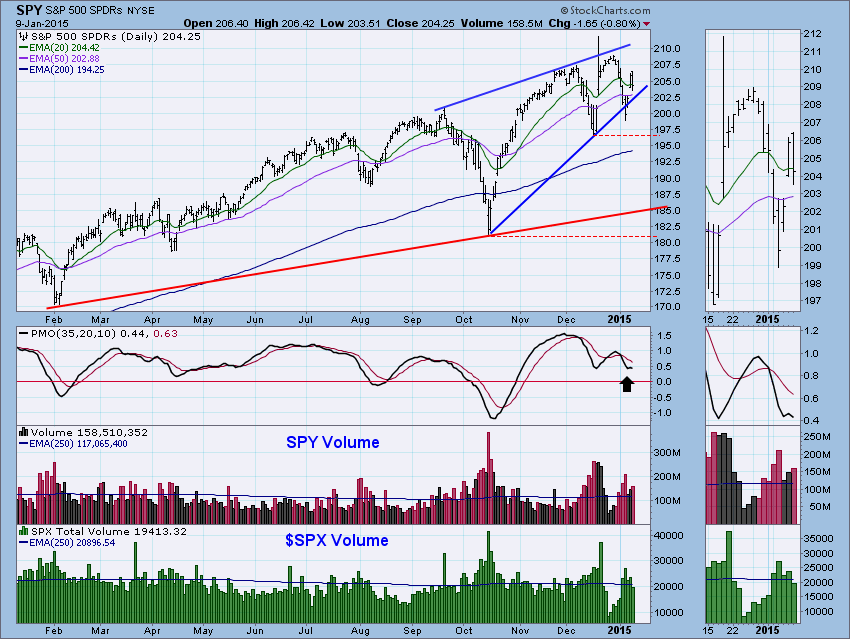
Price snapped back toward support along the bottom of the rising wedge. The formation technically executed when price broke down from it, but it is still there. You could redraw the support line to the bottom formed this week and it would still be an ascending wedge formation. So consequently we should expect price to break down out of it again if it follows the textbooks. The PMO which had finally turned back up, topped below its EMA. This is very bearish.
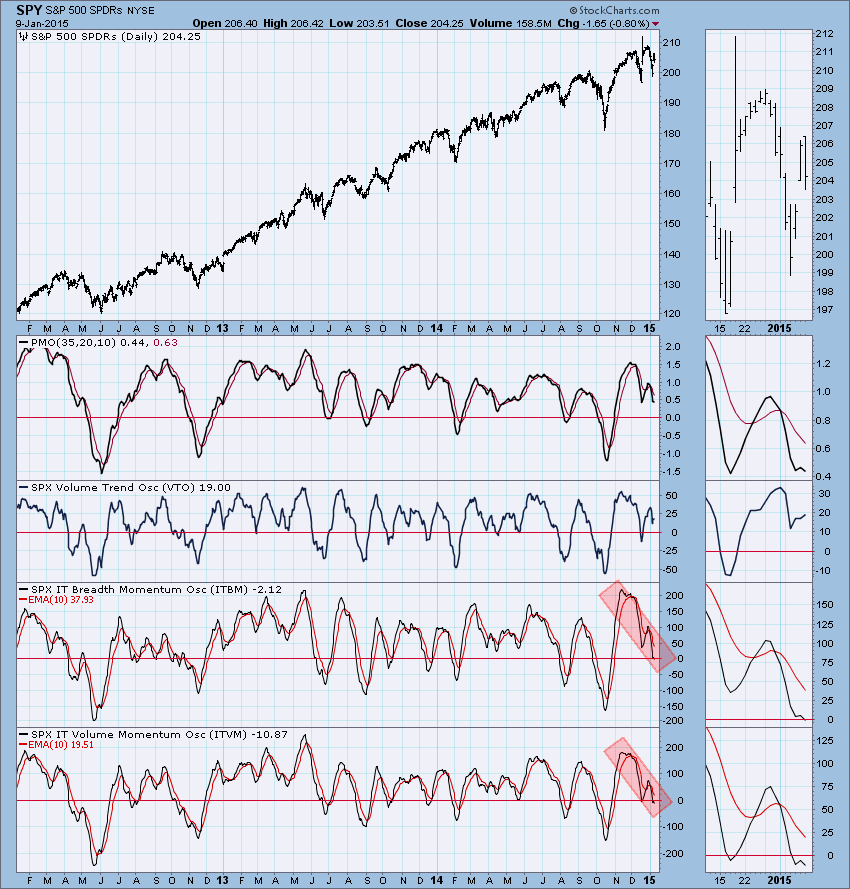
The weekly picture still looks rather negative with price making its way back down. The PMO is declining for a second week but hasn't yet had a negative crossover.
Ultra-Short-Term Indicators: Nothing exciting to report on ultra-short-term indicators. Breadth was negative, but that is to be expected.
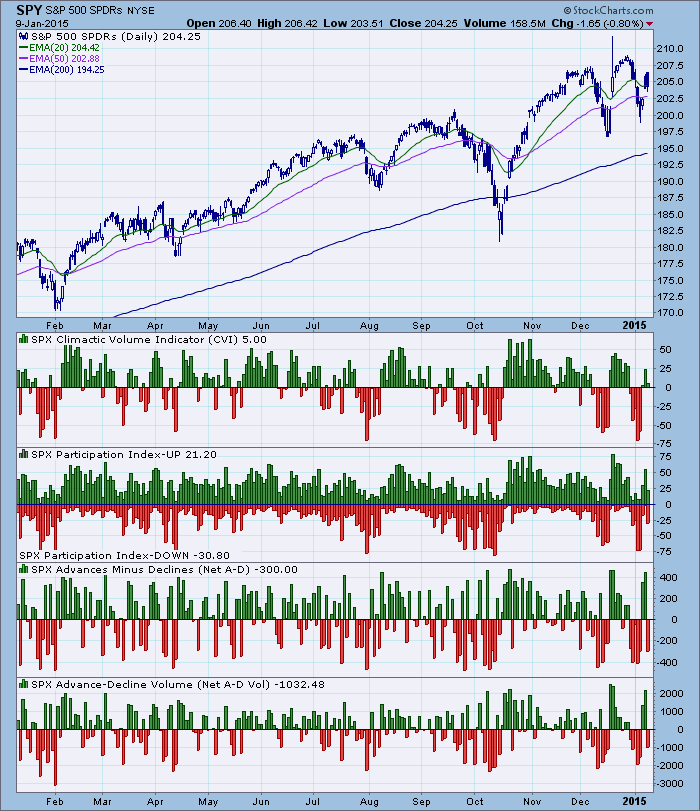
Short-Term Indicators: Short-term indicators are still looking bullish, they are rising out of extremely oversold territory and haven't reached neutral yet. They did begin to decelerate as the market fell lower.
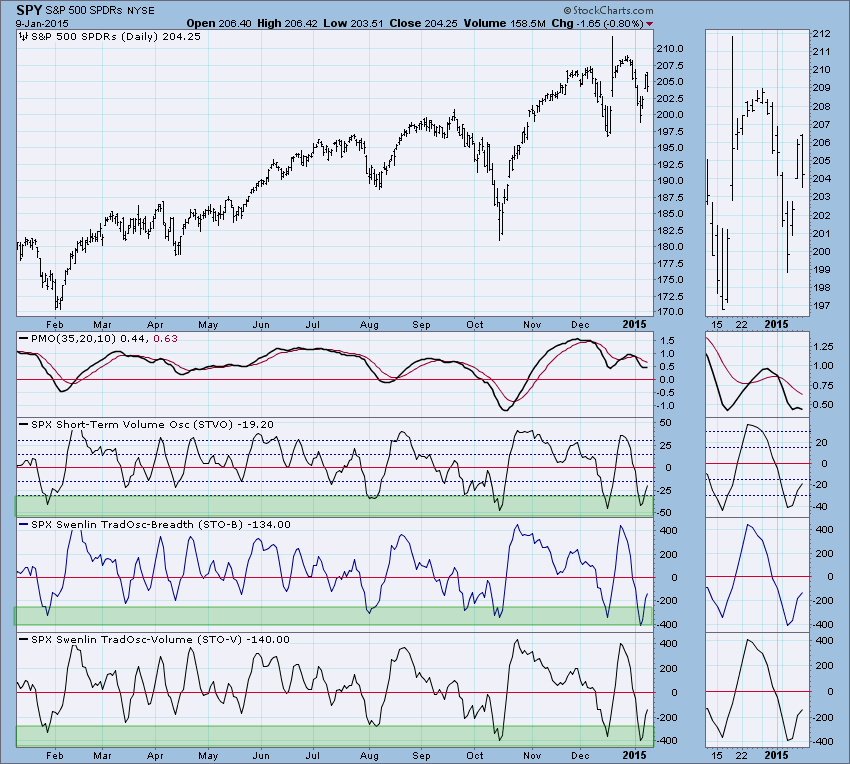
Intermediate-Term Indicators: They are trending lower and today turned back down below their EMAs. Definitely a bearish configuration.
Conclusion: The market backed off the recent rally but hasn't quite reached support yet. Short-term indicators are still positive but they look like they may turn back down. Intermediate-term indicators, with another top below their EMAs, look very bearish. Based on short-term indicators, I could another bounce that would get them at least to neutral, but intermediate-term indicators tell us that the wedge should execute.
* Thank you to everyone who has left supportive comments for our family. I've read every one of them to Carl and it really makes him feel good. I don't think he really realizes how he has impacted many of you over the years.
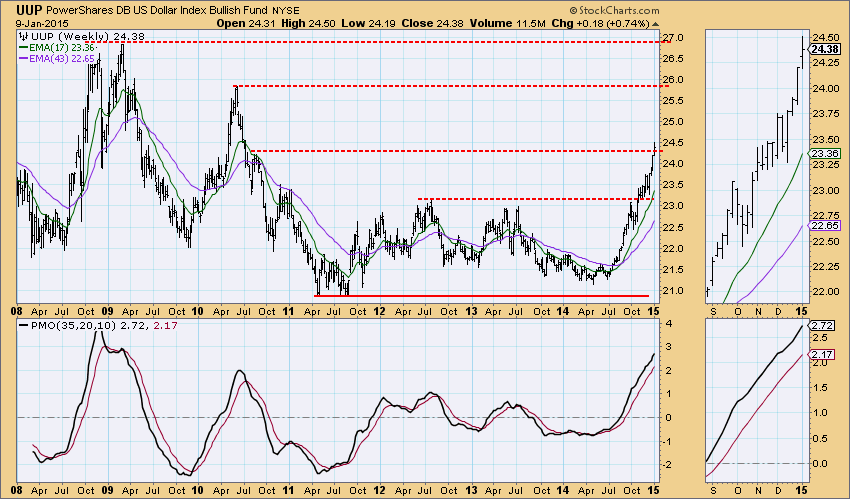
DOLLAR: As of 7/21/2014 the US Dollar Index ETF (UUP) is on a Trend Model BUY signal. The LT Trend Model, which informs our long-term outlook, is on a BUY signal as of 8/21/2014, so our long-term posture is bullish.
Price broke above interim support on its way up to the 2010 high. The PMO looks great and hasn't reached extremes yet. It is not out of the realm of possibility that it will test those highs.
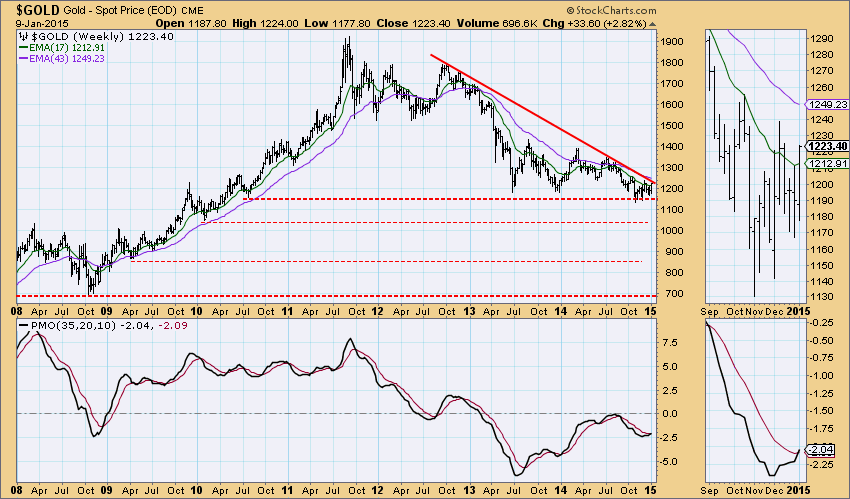
GOLD: As of 8/21/2014 Gold is on a Trend Model SELL signal. The LT Trend Model, which informs our long-term outlook, is on a SELL signal as of 2/15/2013, so our long-term posture is bearish.
Gold is moving in an ever tightening triangle and has not picked a direction. Typically a triangle like this, a descending triangle is bearish. With the dollar looking so strong, a breakdown seems likely.
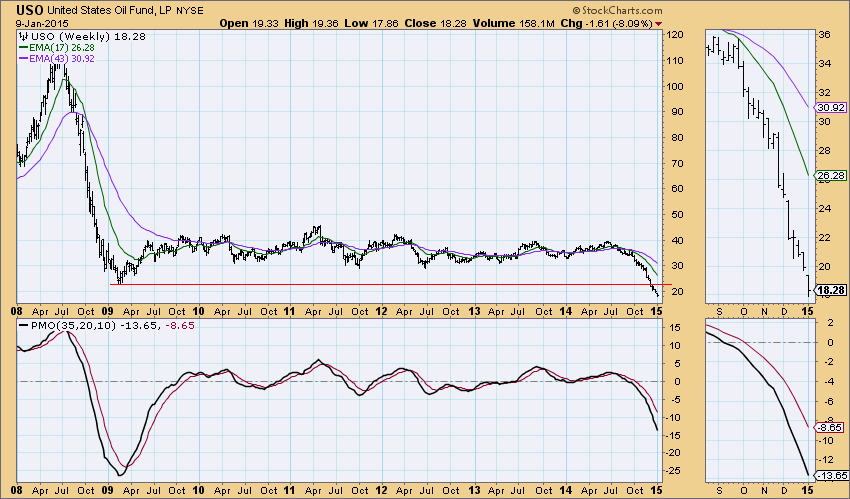
CRUDE OIL (USO): As of 7/30/2014 United States Oil Fund (USO) is on a Trend Model NEUTRAL signal. The LT Trend Model, which informs our long-term outlook, is on a SELL signal as of 8/28/2014, so our long-term posture is bearish.
USO continues to suffer, hitting all-time lows. We can see that the PMO could actually move much lower before hitting oversold extremes.
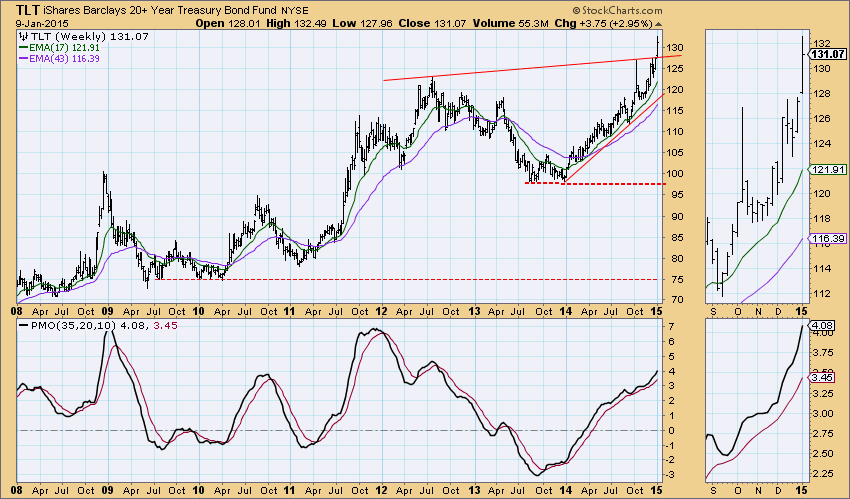
BONDS (TLT): As of 1/17/2014 The 20+ Year T-Bonds ETF (TLT) is on a Trend Model BUY signal. The LT Trend Model, which informs our long-term outlook, is on a BUY signal as of 3/24/2014, so our long-term posture is bullish.
TLT broke out in a big way this week, nearly having a 'decisive' breakout which is a 3% move above or below support/resistance. The PMO is far from being overbought, so even though TLT has reached all-time highs this week, more are definitely possible.
Technical Analysis is a windsock, not a crystal ball.
Happy Charting!
- Erin
