Since late-June, prices have been moving higher, while the number of new 52-week highs has been fading. On the face of it this might be cause for concern; however, there are a couple of things that mitigate this apparent weakness.
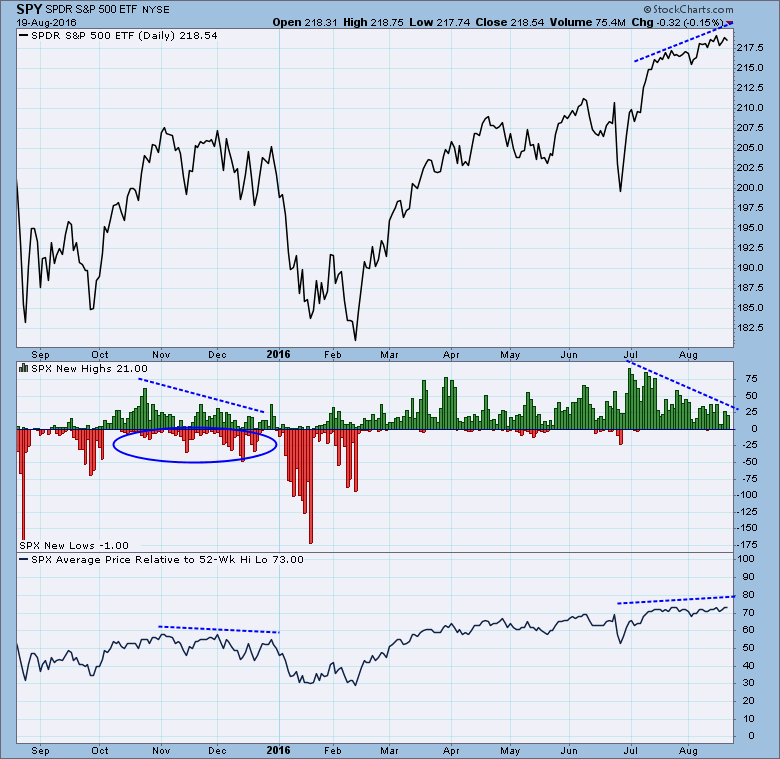
First, while new highs have been contracting, there has been no expansion of new 52-week lows. Conveniently, there is an example of a combination of shrinking new highs and expanding new lows during the last three months of 2015, which I have annotated on the chart. This condition eventually led to a correction during January and February of this year. The current absence of new lows makes it less likely that we will see a similar result now.
Another indicator shown on the chart is the Average Price Relative to the 52-Week High/Low, or "Rel-to 52" for short. Rel-to-52 expresses the location of the current price of a stock relative to its 52-week high and low. If price is at the 52-week high, the Rel-to-52 would be 100, or if price were at the 52-week low, the Rel-to-52 would be zero (0). The chart expresses the average Rel-to-52 for all the stocks in the S&P 500. The current reading of 73 is a healthy number, but more important is the fact that the index has been rising along with price. So, while fewer stocks are making 52-week highs, the majority of stocks are holding their ground or gaining strength. (Note that the Rel-to-52 was in a declining trend preceding the January-February correction.)
CONCLUSION: The contraction of new 52-week highs during July and August may lead to a price pullback in the short-term, but the absence of new 52-week lows during the same period implies that a serious price correction is not likely. Another positive bit of evidence provided by the Rel-to-52 indicator is the fact that, as a group, stocks in the S&P 500 are moving higher within their 52-week high/low range. This confirms the existence of broad-based strength in the market and implies that the issue of fading new highs is short-term in nature.
Technical analysis is a windsock, not a crystal ball.
