I decided to take a look at the Rydex Ratio today to see what the daily assets might be telling us as far as "actual money" sentiment. Here's a refresher for those new to the Rydex Ratio and sentiment readings in general. First, sentiment tells us if market participants are feeling bullish or bearish. The sentiment polls measure those "feelings" by simply asking those polled whether they are bullish or bearish on the market.
The Rydex Assets chart shows the reality of what investors are actually doing with their money. Many times it will not sync with the polls.
We must also remember that sentiment is contrarian. This means that when there is excessive bullishness among investors, that is bearish for the market. We want to find that saturation point.
Rydex Funds report the current assets in each fund nightly and we track the readings in baskets. Guggenheim bought Rydex and renamed the funds to Guggenheim. They still have the original Rydex symbols. As a tribute, Carl retained the Rydex name for the ratios.
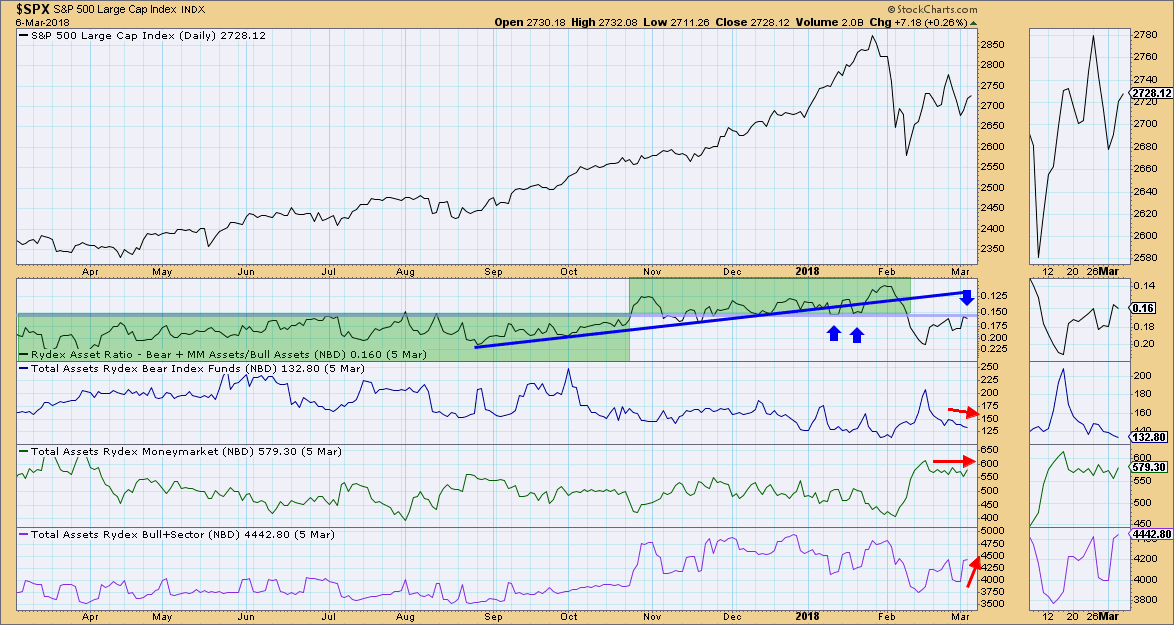
The bear funds are one basket, bull funds are another and money market assets complete the trio. We tally up the assets in bear and money market funds (bearish vehicles) and divide them by the bull funds to come up with our ratio. The smaller the ratio, the more bullish money flows are.
Note that money has left and continues to trickle out of bear funds. Money market assets remain about the same, so we're not seeing increased worry or cashing out. In fact, we are seeing money now flowing to bull funds. Overall this tells us that investors are more bullish, though not excessively so (money market assets stagnating not decreasing).
Greg Schnell awhile back had pointed out the failure of the ratio along the rising bottoms trendline. We saw it happen twice right before the correction. Also, the ratio hit its highest value shortly before the correction. What we should be aware of is that despite the ratio not reaching previous overbought extremes as we saw during the parabolic rally, it has hit the 'normal' saturation point and is heading lower. We may not see a move back into that upper zone for some time, so I suggest some caution buying into the latest rally based on the topping Rydex Ratio.
Helpful DecisionPoint Links:
DecisionPoint Shared ChartList and DecisionPoint Chart Gallery
Price Momentum Oscillator (PMO)
Swenlin Trading Oscillators (STO-B and STO-V)
Technical Analysis is a windsock, not a crystal ball.
Happy Charting!
- Erin
**Don't miss DecisionPoint Commentary! Add your email below to be notified of new updates"**
