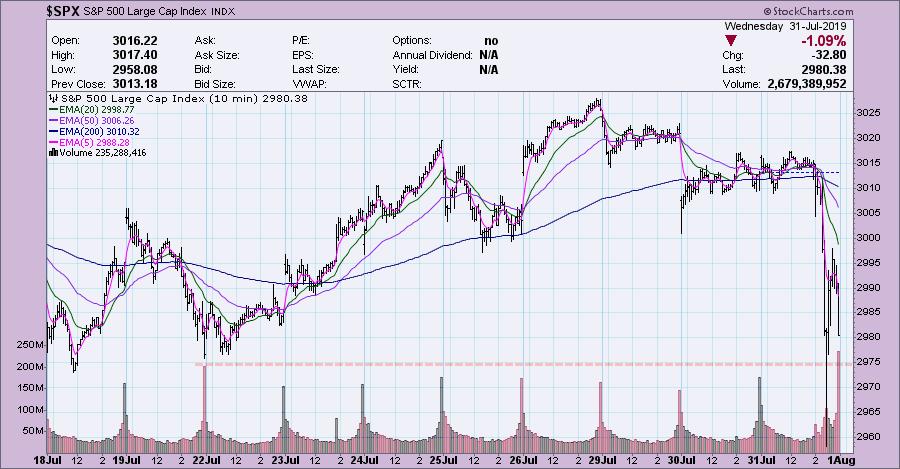
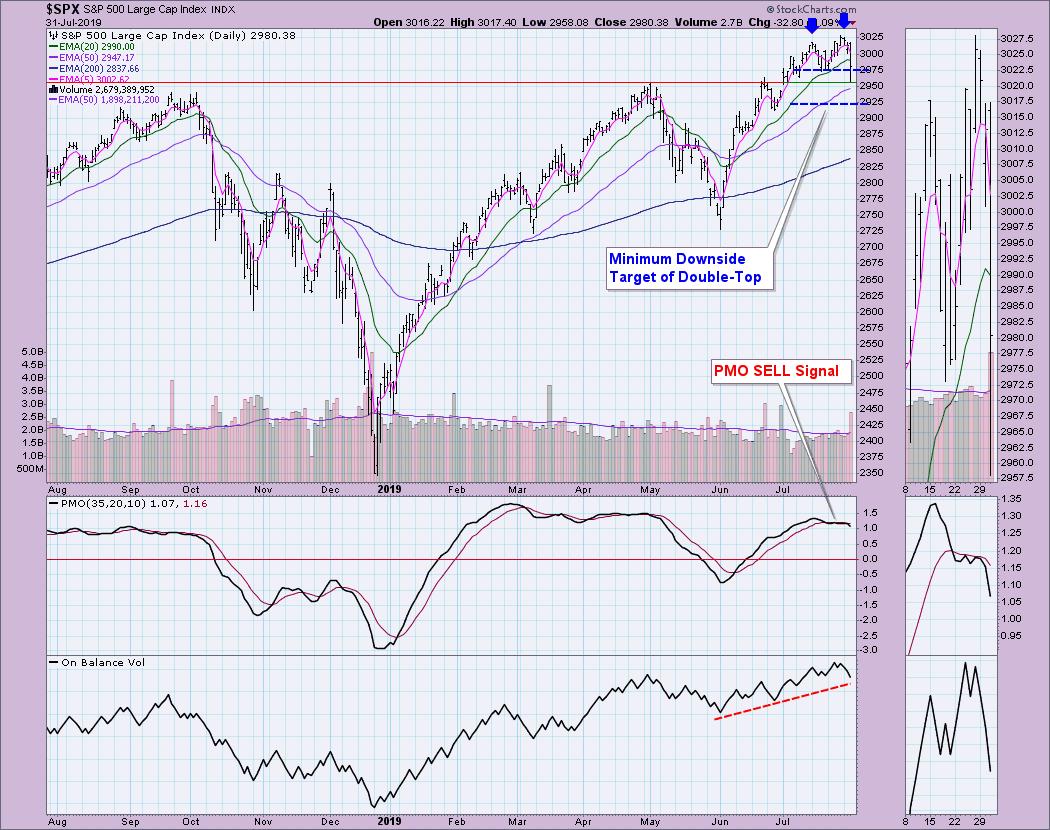
 While the Fed didn't do anything unexpected, market participants were not excited about the language of Chairman Powell. The 10-minute bar chart below shows the spike in volume that finished the day, which is the biggest volume finish in the past two weeks. The question is whether it is a selling exhaustion or initiation. We are seeing new Price Momentum Oscillator (PMO) SELL signals on the major indexes, which suggests further decline. I also spy (with my little eye) a double-top on the SPX that, with today's drop, executed.
The DecisionPoint Alert presents a mid-week assessment of the trend and condition of the stock market (S&P 500), the U.S. Dollar, Gold, Crude Oil and Bonds.
Watch the latest episode of DecisionPoint on StockCharts TV's YouTube channel here!
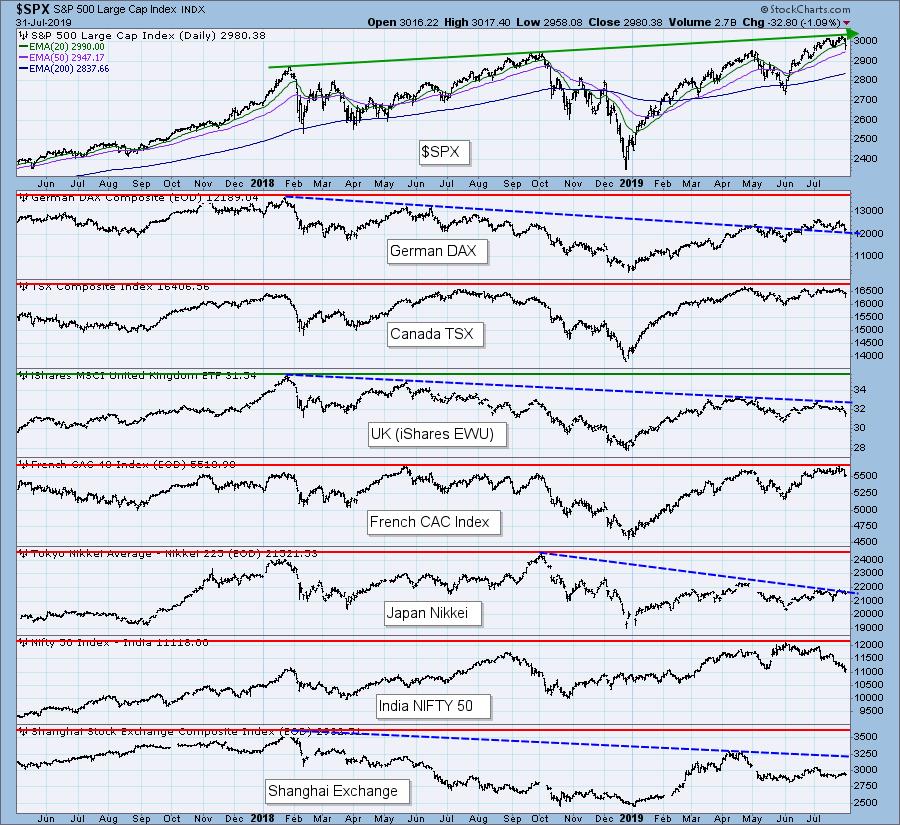
GLOBAL MARKETS
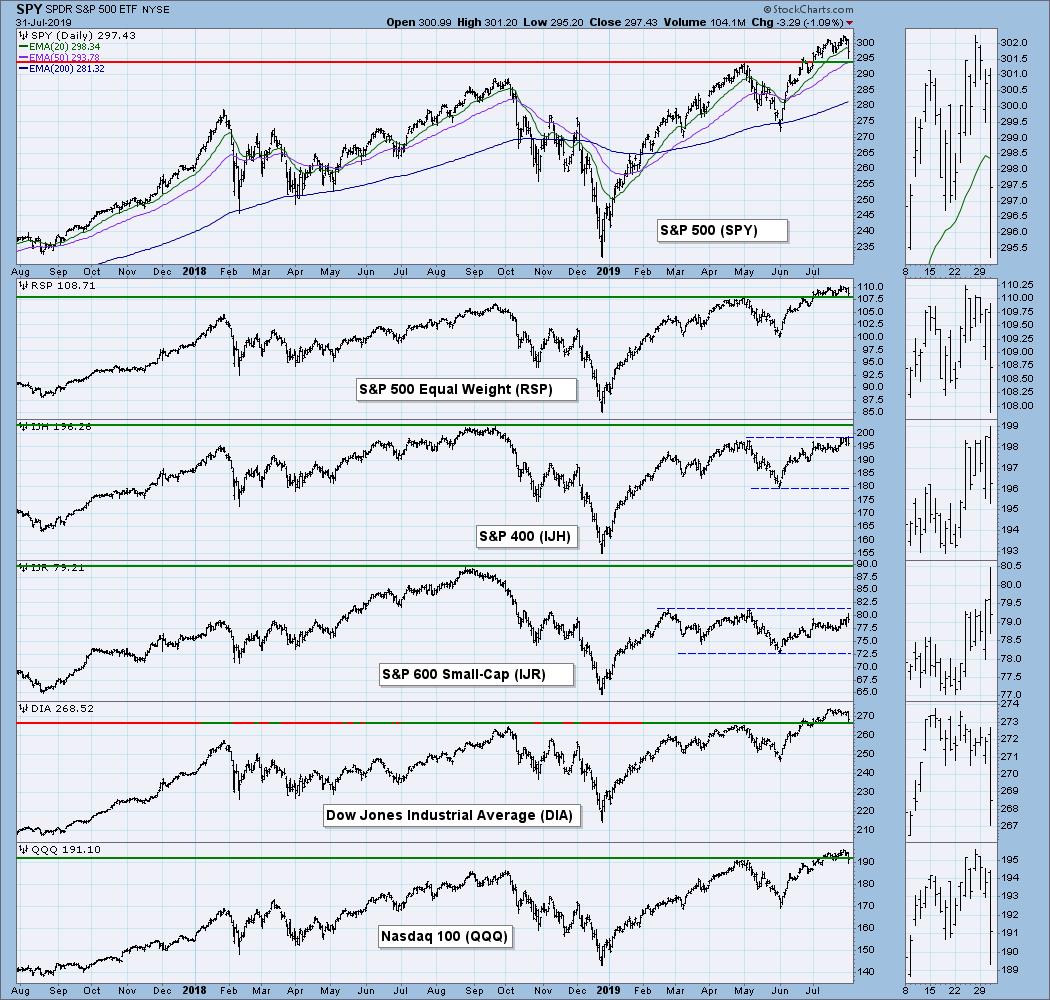
BROAD MARKET INDEXES
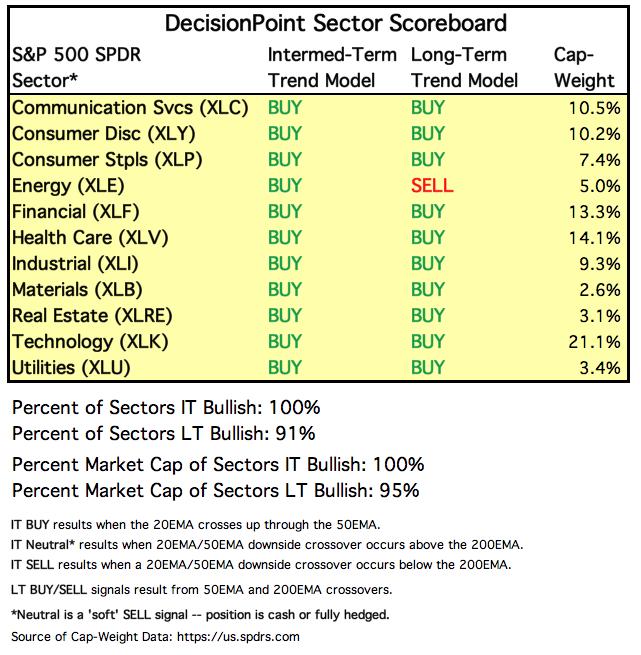
SECTORS
Each S&P 500 Index component stock is assigned to one, and only one, of eleven major sectors. This is a snapshot of the Intermediate-Term and Long-Term Trend Model signal status for those sectors.
STOCKS
IT Trend Model: BUY as of 6/11/2019
LT Trend Model: BUY (SPY) as of 2/26/2019
SPY Daily Chart: I'll be starting with the daily charts and adding the monthly charts later. The PMO SELL signal came in on 7/22/19. The feature that was already troubling me was the formation of a possible double-top. These are bearish patterns and, with today's drop, have technically executed (the close was still above the confirmation line, but I consider this a breakdown). The minimum downside target is around 2925, which is a reasonable pullback and possible area for support. This certainly has the earmarks of a selling initiation.
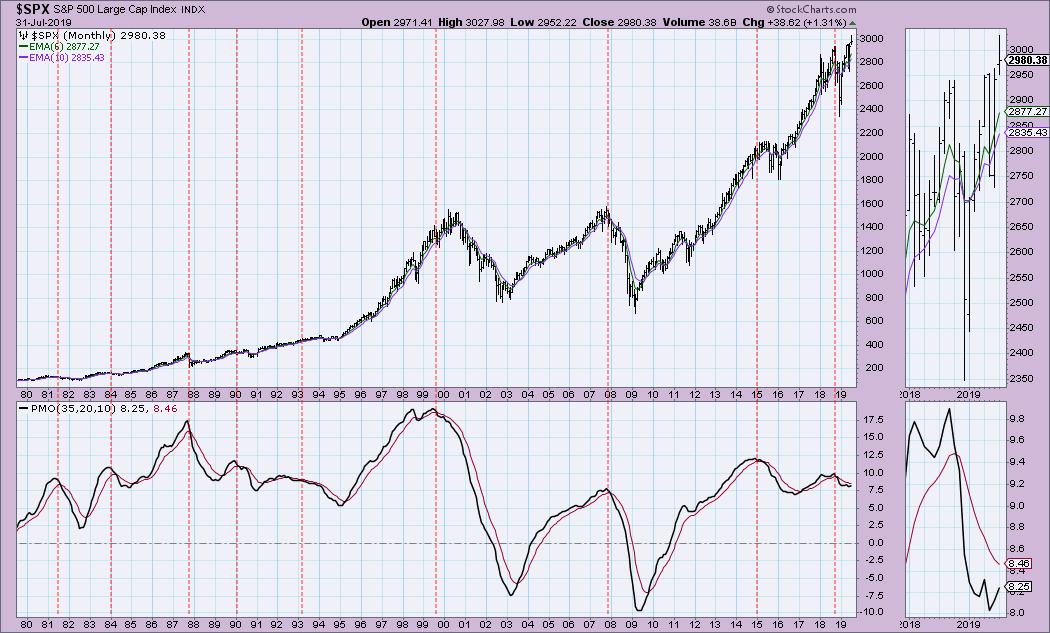
The SPX finished July with a 1.31% gain. The monthly PMO isn't decelerating, but it has yet to print a BUY signal.
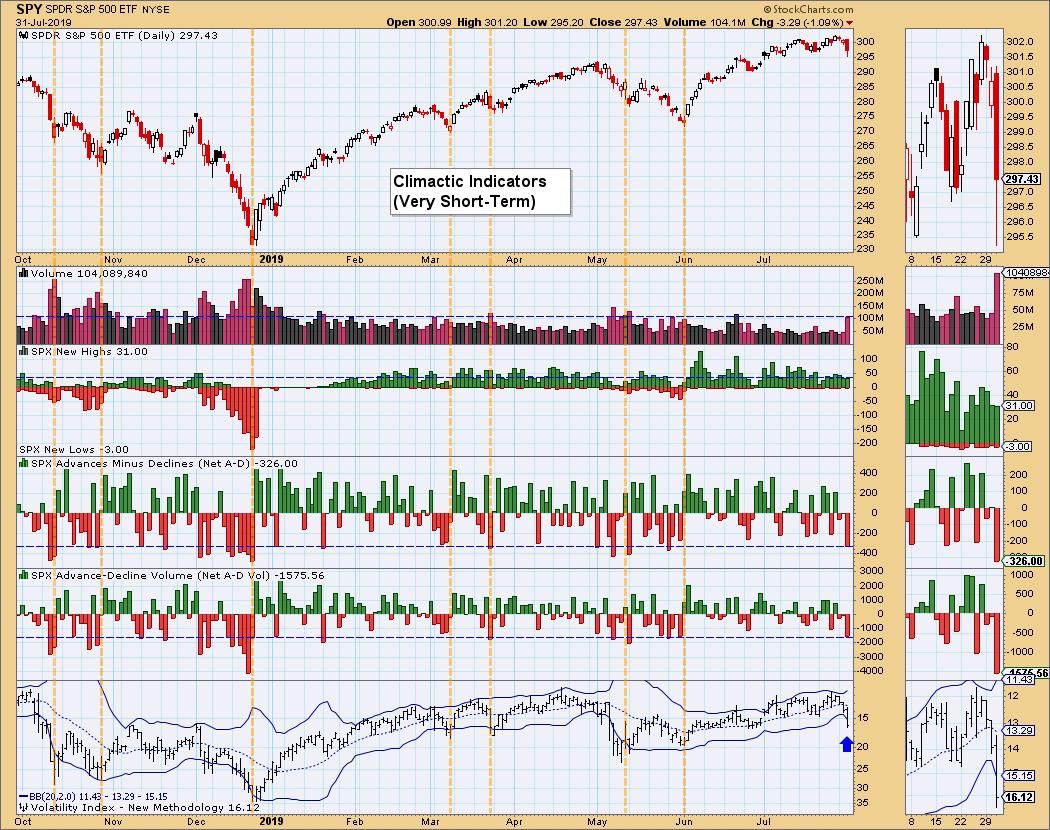
Climactic Market Indicators: This chart suggests a possible selling exhaustion, given the location of the VIX. Generally, when the VIX punctures the bottom Bollinger Band, that is a good time to look for a price reversal. However, I should note, when we were looking at the selling initiations (like early May), the VIX can continue to push and stay beneath the bottom Bollinger Band until the selling has played out. Breadth was very climactic to the downside. I'm going out on a limb and calling this an initiation that will lead to lower prices for a few days longer.
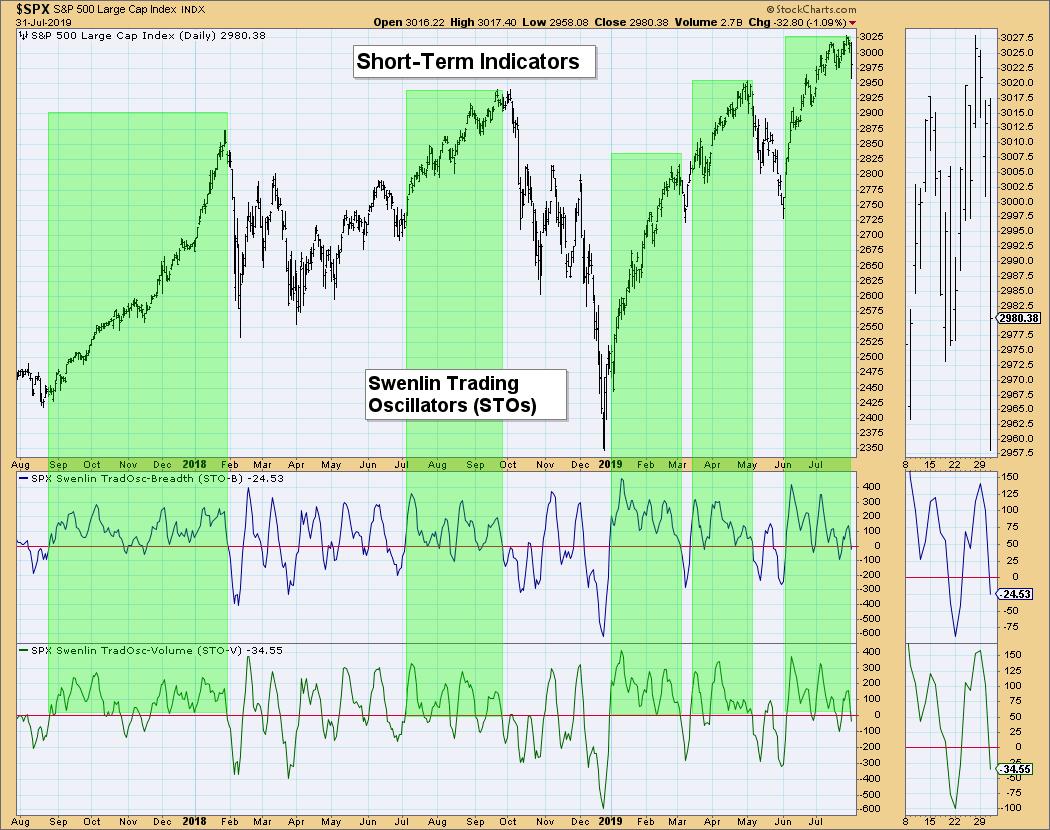
Short-Term Market Indicators: The STOs have now moved down below the zero line, which is the danger zone for these indicators. Note that, when they stay above zero, rallies tend to continue. This is only a small move below zero, but I'll be watching closely to see if they continue to decline.
Intermediate-Term Market Indicators: The negative divergence between price tops and indicators generally precedes a decline.
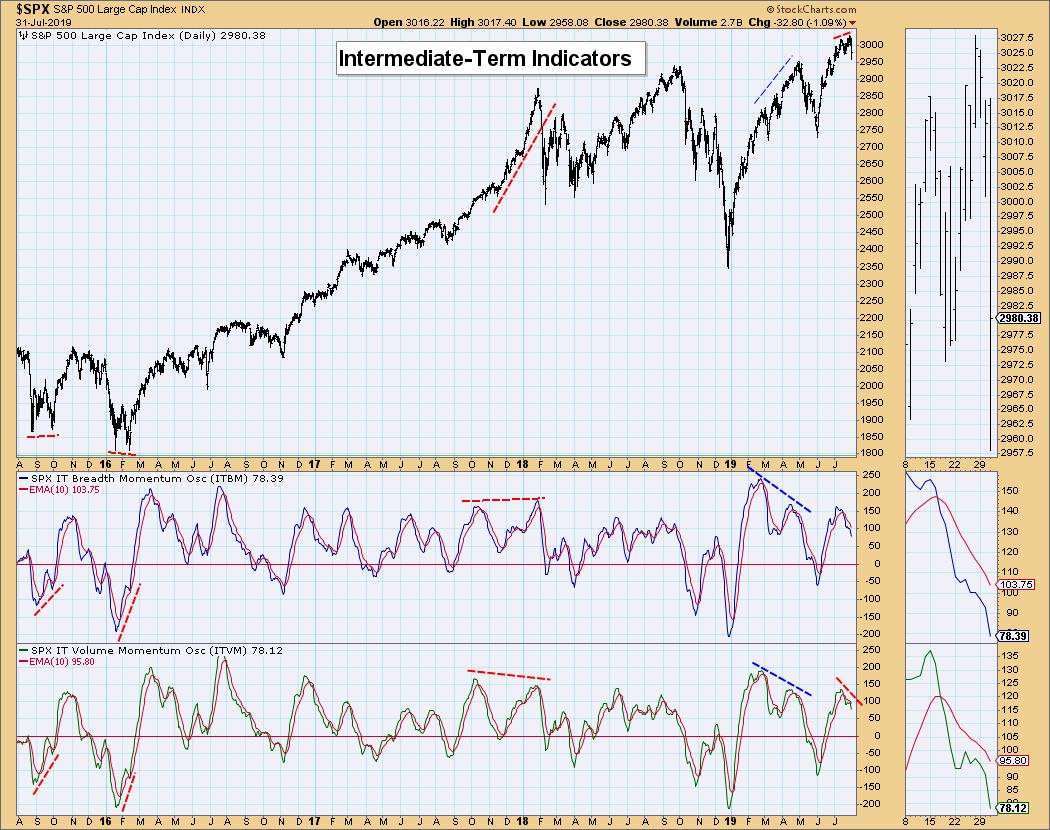
Conclusion: Today's high volume drop was accompanied by PMO SELL signals on the major indexes, STOs dropping below the zero line, a negative divergence on IT indicators, climactic negative breadth and a bearish double-top. The only possible plus would be a VIX that has popped below the lower Bollinger Band. I am looking for lower prices through the end of this week.
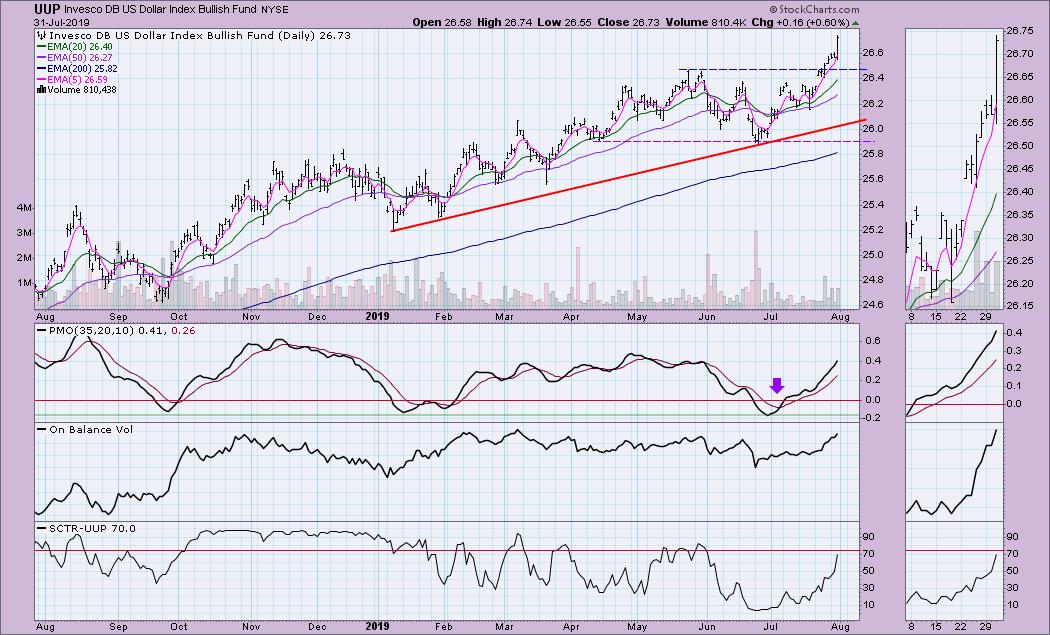
DOLLAR (UUP)
IT Trend Model: BUY as of 2/7/2019
LT Trend Model: BUY as of 5/25/2018
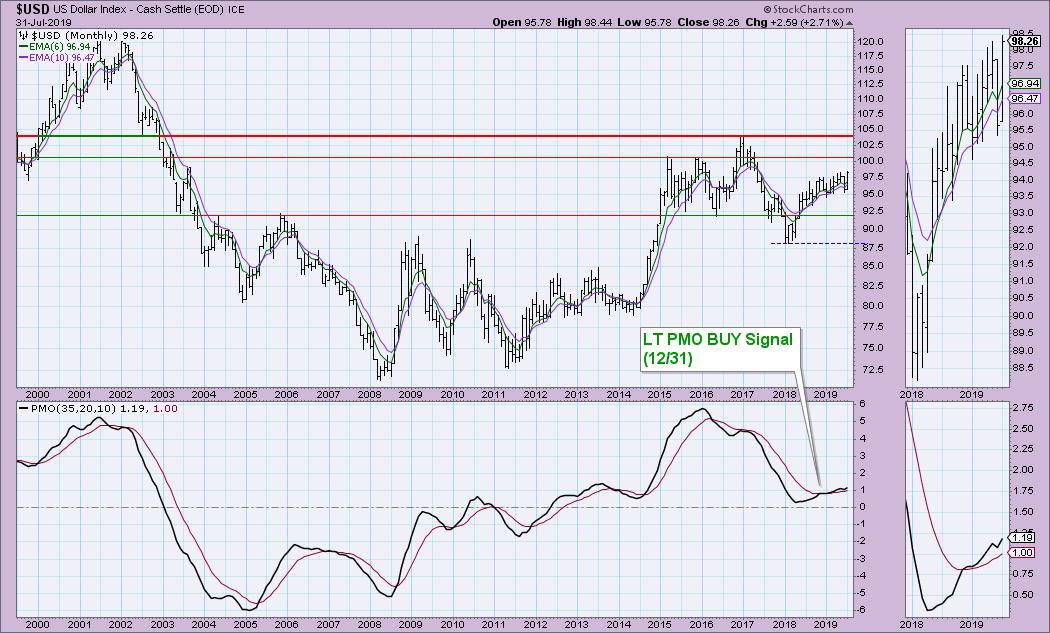
UUP Daily Chart: The Dollar had a great day. UUP can certainly climb higher given the PMO rising and not being in overbought territory. The monthly chart for $USD shows overhead resistance arriving at 100. I don't see anything to suggest that won't happen. We could see a pullback from this rally today, but overall I'm looking for the Dollar to rise.
GOLD
IT Trend Model: BUY as of 6/3/2019
LT Trend Model: BUY as of 1/8/2019
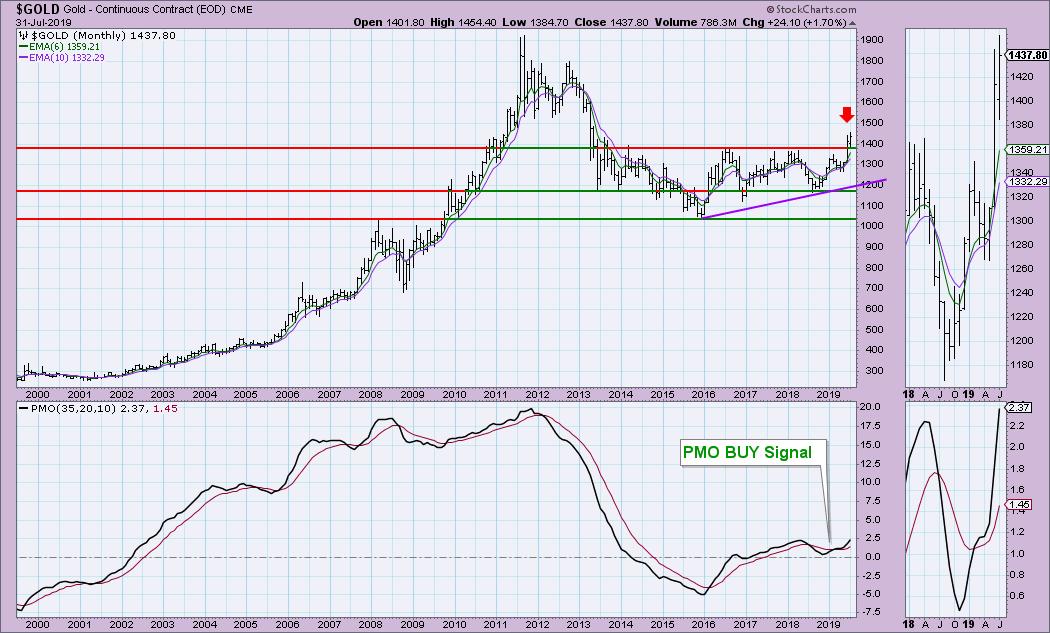
GOLD Daily Chart: Gold is in a wide rising trend channel. Discounts are still somewhat high, which is bullish. The PMO is showing a reluctance to rise, but it isn't configured negatively. Note that the correlation between the Dollar and Gold is positive. This suggests that a rising Dollar won't hurt Gold as much as it usually does (they travel in opposite directions because Gold is priced in the Dollar). This positive correlation tells me that there are buyers out there. UUP rose 0.60%, but Gold only sustained a 0.28% drop. Buyers are offsetting that negative correlation.
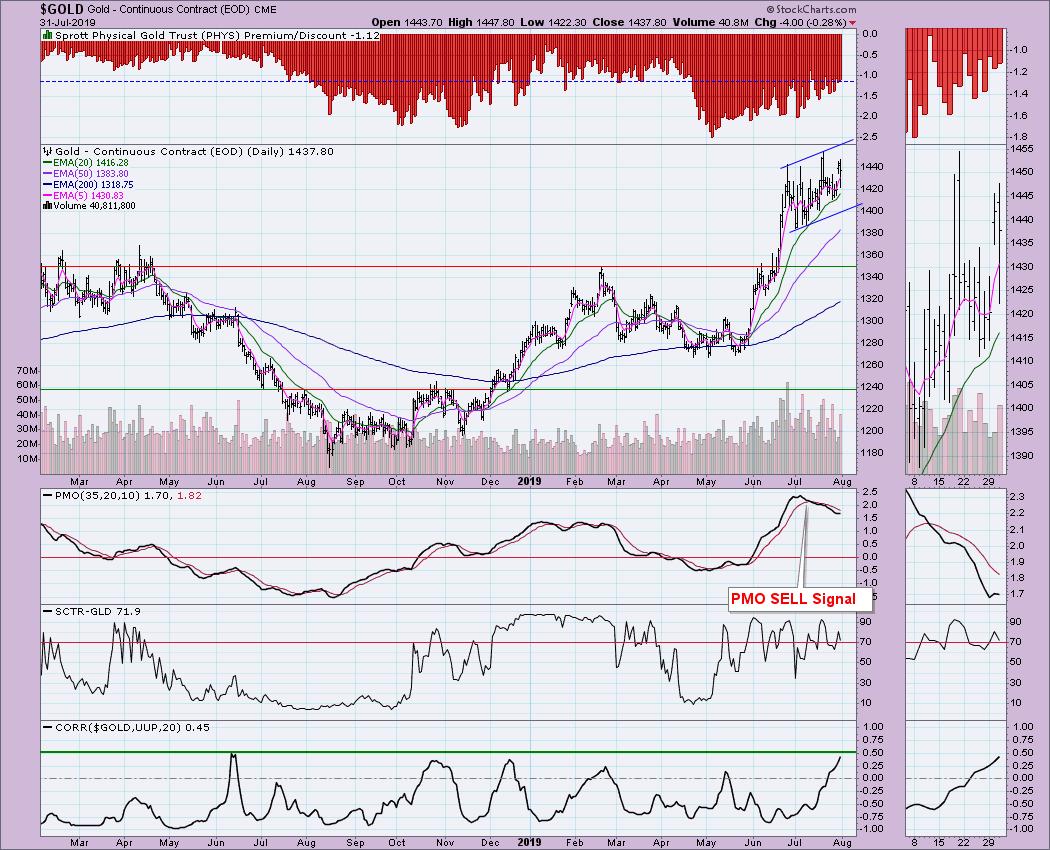
The monthly chart for Gold demonstrates how impressive the recent rally has been - resistance that had held up for over 5 years was finally broken. This month, Gold traded above that resistance. The PMO is rising nicely and isn't at all overbought.
CRUDE OIL (USO)
IT Trend Model: Neutral as of 5/30/2019
LT Trend Model: SELL as of 6/4/2019
USO Daily Chart: USO bounced off support at the gap from mid-June and is continuing higher. A new Short-Term Trend Model BUY signal appeared today as the 5-EMA crossed above the 20-EMA. Add to that a new PMO BUY signal and things may be looking up. My concern now is the resistance at the 200-EMA. The price top earlier this month holds more weight, in my opinion. Traders remember a price top, but most don't have any idea what a 200-EMA is. I suspect price will challenge resistance at $12.60.
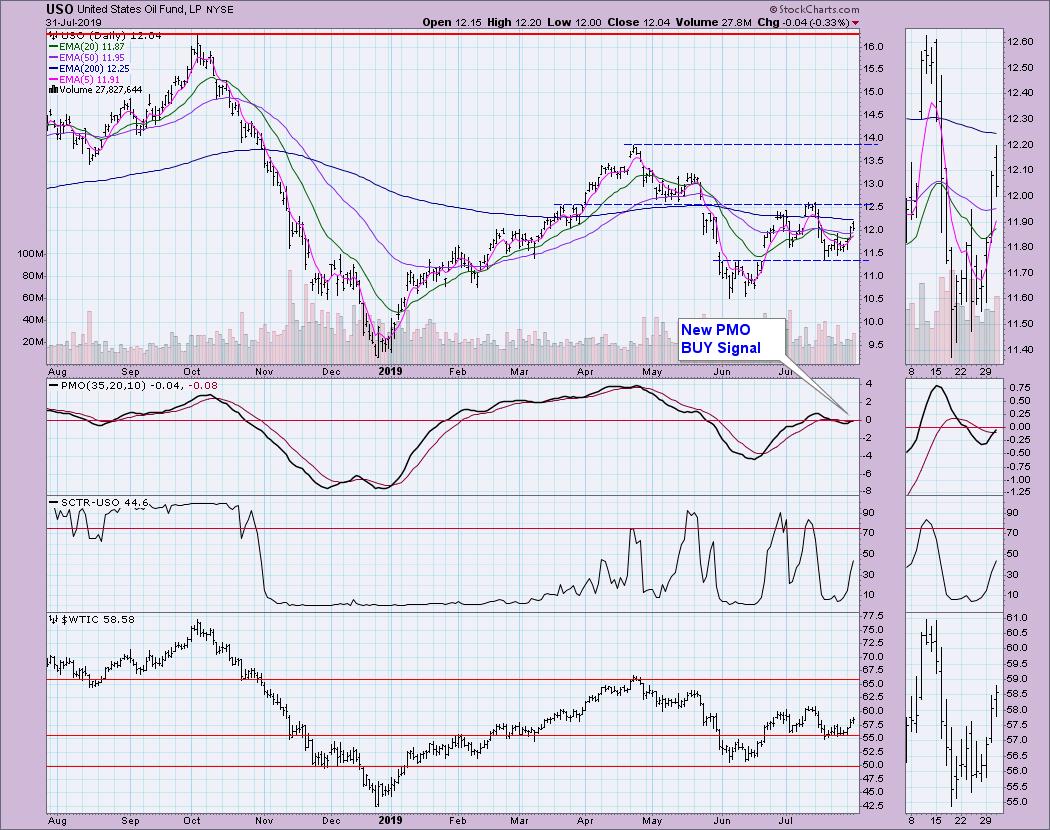
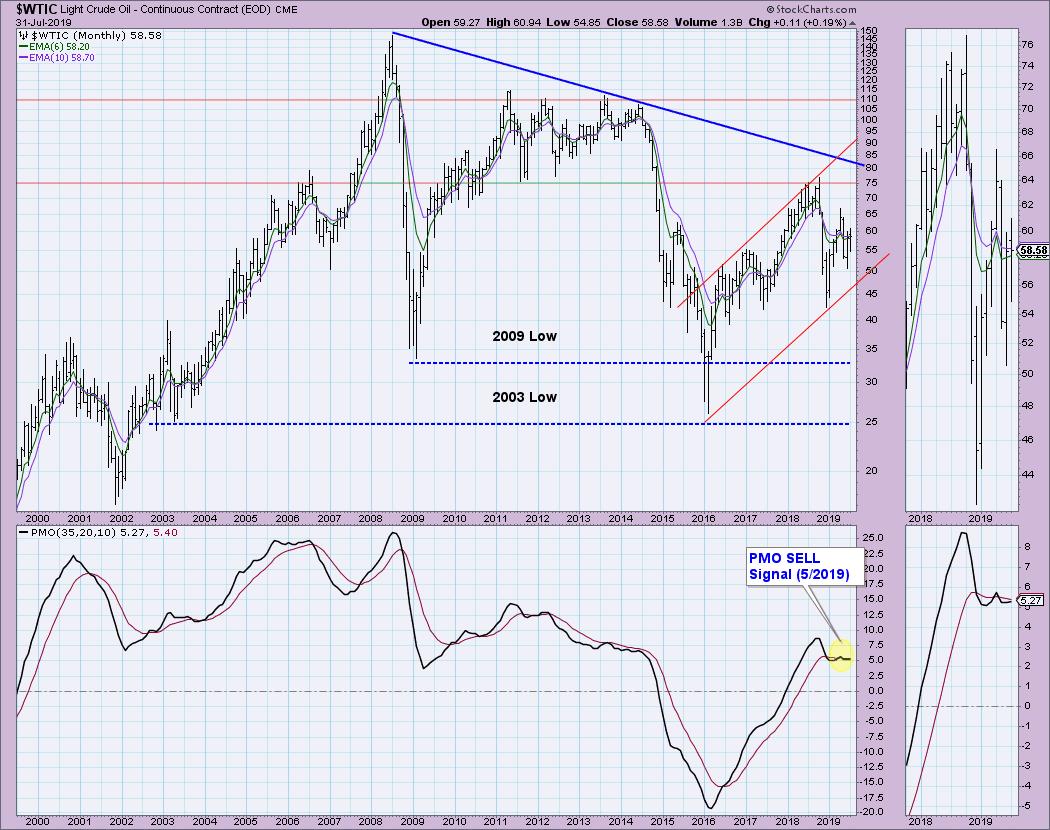
Oil is still technically in a rising trend channel. Unfortunately, it is very wide, so price can deteriorate quite a bit and remain in the rising trend. I like that the PMO has flattened and now appears ready for a positive crossover.
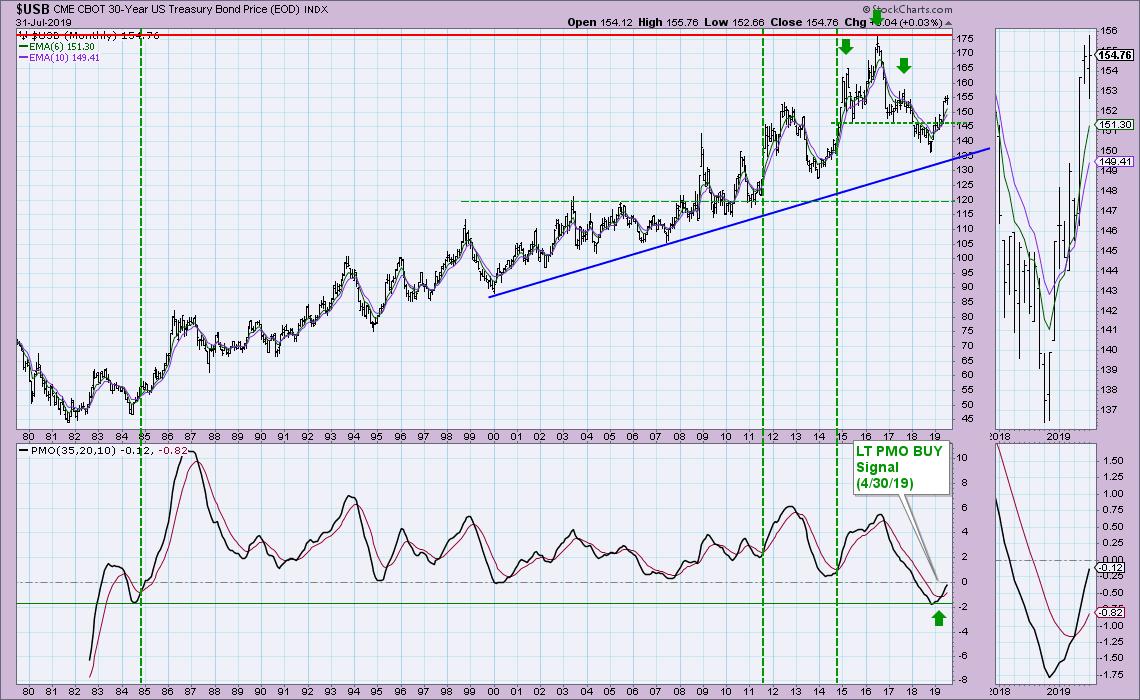
BONDS (TLT)
IT Trend Model: BUY as of 12/6/2018
LT Trend Model: BUY as of 1/2/2019
TLT Daily Chart: Bonds broke out of a short-term declining trend and managed to remain above the 20-EMA. The PMO has turned up and the SCTR has moved into the "hot zone" above 75.
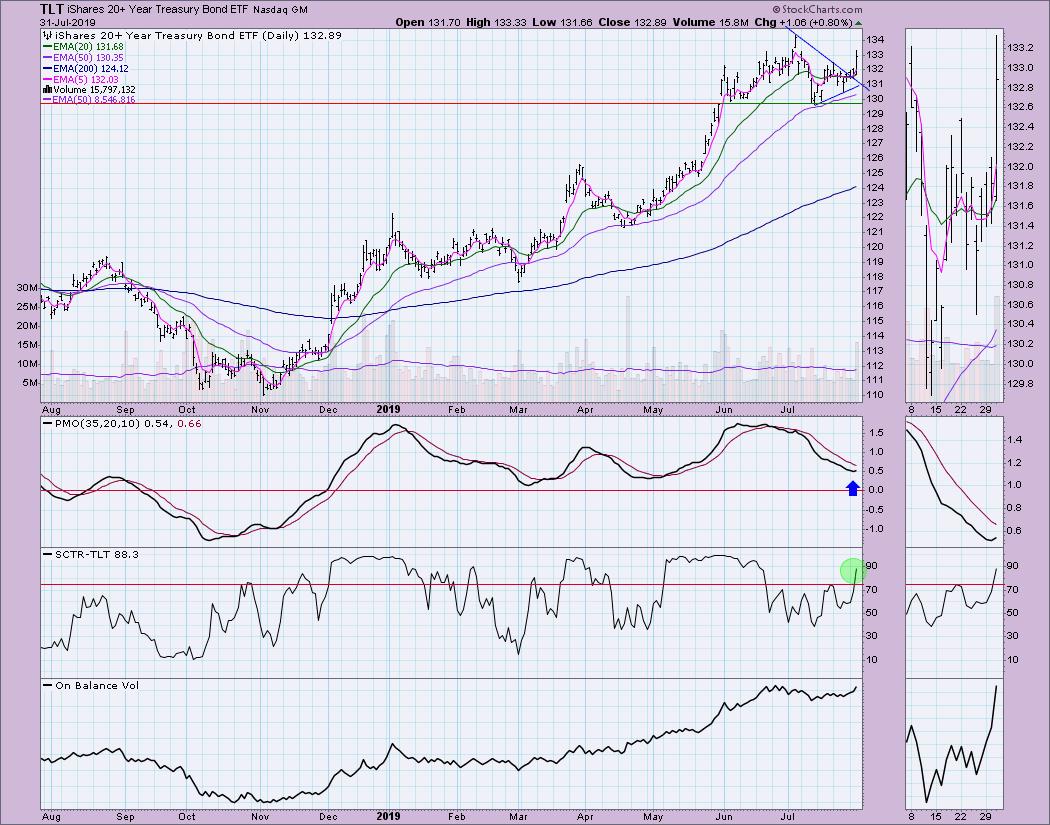
The rising trend remains on the monthly chart. The monthly PMO is about to move above the zero line. Bonds still look quite bullish.
Technical Analysis is a windsock, not a crystal ball.
Happy Charting! - Erin
Email: erinh@stockcharts.com
**Don't miss any of the DecisionPoint commentaries! Go to the "Notify Me" box toward the end of this blog page to be notified as soon as they are published.**
NOTE: The signal status reported herein is based upon mechanical trading model signals, specifically, the DecisionPoint Trend Model. They define the implied bias of the price index based upon moving average relationships, but they do not necessarily call for a specific action. They are information flags that should prompt chart review. Further, they do not call for continuous buying or selling during the life of the signal. For example, a BUY signal will probably (but not necessarily) return the best results if action is taken soon after the signal is generated. Additional opportunities for buying may be found as price zigzags higher, but the trader must look for optimum entry points. Conversely, exit points to preserve gains (or minimize losses) may be evident before the model mechanically closes the signal.
Helpful DecisionPoint Links:
DecisionPoint Shared ChartList and DecisionPoint Chart Gallery
Price Momentum Oscillator (PMO)
Swenlin Trading Oscillators (STO-B and STO-V)
