The $INDU rose over 200 points on Monday and settled back to keep about 1/2 the day's gain. This was a 200 point range or over 1% for the day. In North America we consider that to be a meaningful big day.
With the Dow around 16000, a 1% day is 160 points, a 2% day is 320 points and a 3% day is 480 points.
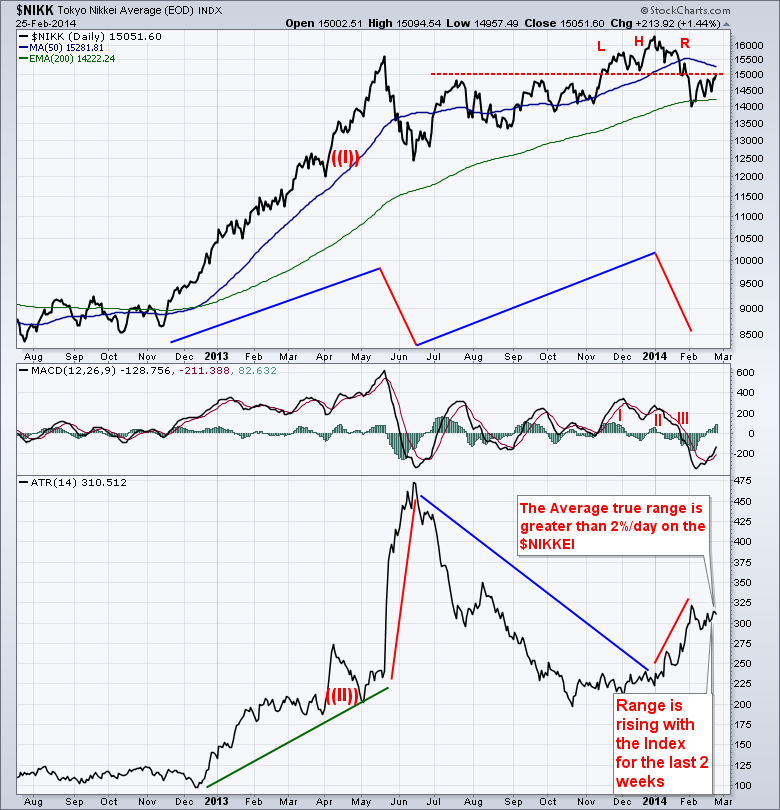
Watching the $NIKK (Japanese Equity Market Index) is not exactly calming. Within the last year the ATR has been higher than 3% / day! This chart is a great example of how the ATR can also be used to help measure volatility and help with recognizing trend change.
When the $NIKK originally broke out in December 2012 the ATR (shown at bottom) also broke out. It is not uncommon for the actual ATR to rise as the price rises where a 1% range in a market is normal. When the $NIKK peaked around 15500, the ATR was around 225 so roughly 1.5%. When the $NIKK fell rapidly, the ATR spiked to ~3.5% per day or 475 points! This is the "average" range over a last 14 day period. We may call it a 14 day average but a 3.5% ATR was remarkably big, not average. The Dow trades roughly a thousand points (16000 vs. 15000) above the $NIKK level. If we were having 500 point swings as an 'average' over the last 14 days, there would be a lot of worry in the market. While everyone discussed the huge run up in the $NIKK back in April May 2013, the daily swing was really remarkable on the one month pull back where the $NIKK dropped 20%. Then as the $NIKK rose, the ATR settled back. The $NIKK high coincides with the $INDU high currently of December 30, 2013. Notice the ATR was not still at the lows. The ATR was roughly 1.3%.
Now the ATR is currently higher than 2% / day which is higher than the first market top and near the highs of the last 7 months. This tells me there is still a lot of unease in Japan on how things will work out. Recently the $NIKK made a rough looking H/S top with a 15000 neckline. We can see how important that neck line has been since the last May 2013 high.
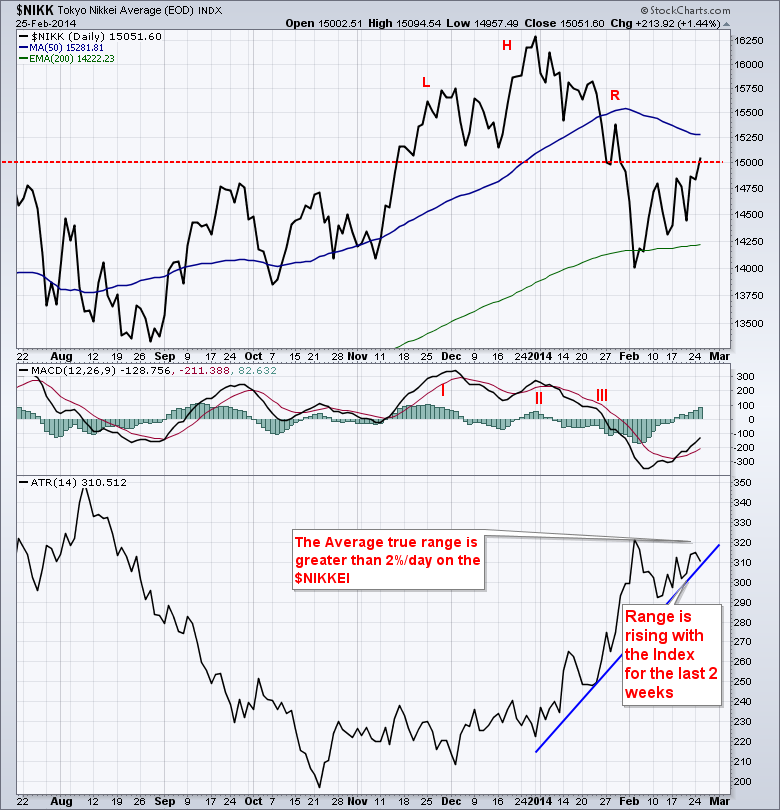
Lets zoom in on the right edge of the chart.
SO while the market is chopping back and forth, the range continues to hold up at very high levels greater than 2%. The index lost 1300 points in the last week of January and early Feb. It also made a bottom when the US markets did. After bouncing off the 200 DMA, the $NIKK chopped higher which I would say is overlapping and a countertrend move. If the $NIKK continues to rise above the early February ATR level, I would not be surprized to see the equity market fall. If the $NIKK can break down through the blue uptrend line, I would place greater hope that world markets continue to rise. As the world seems to be trading tick for tick with the $XJY currency on crosses with the Euro and the dollar, a major move either way in Japanese equities would probably be a currency related move which will affect foreign markets.
So if the Japanese equity market can continue to rise and the ATR drop down to a 1 - 1.5% level, the global bull trend may stay intact. Should this ATR or 'daily volatility' increase, I think we can expect the global markets to move similar to the $NIKK. With the corrective climb (overlapping moves or choppiness) taking place, a break in the $NIKK would be important. We can see this red line has been important and the $NIKK touched it today. If it holds as resistance, and pushes the $NIKK down sharply, North American equity markets may have an early clue to the large topping process finally concluding. Should the $NIKK calmly rise from here and see the ATR drop, it would lead me to believe that more equity bull outcomes are on the horizon. Is the US driving the $NIKK or the $NIKK driving the US? I think the Japanese currency is driving most of it. At this point with the high ATR (and rising almost all of February) on the $NIKK, I am getting more nervous.
Good trading,
Greg Schnell, CMT


