Morgan Stanley (MS) had a beautiful run in 2013. In 2014, MS continued to make mostly higher lows but the ceiling was capped in the $33 - $33.50 range. Today it is back there testing it again.
While we commonly look at charts over the past 2 years, how about looking at 15 years of history for Morgan Stanley. Here is just a crazy coincidence. Back in 1998 MS hit $33.50. When looking across the chart this was a massive support and resistance zone for Morgan Stanley. It oscillated around it all of 1999, it was not broke until 9/11/2001. It became resistance for the 2002 -2003 lows, support in 2004, 2005. It was tested during the Bear Stearns collapse and then plummeted during the Lehman Brothers collapse. On the revival bounce in 2010, it stalled at...$33.42. In January 2014, it returned to the $33 level and we have tried at least 5 times this year to exceed it. Wow!
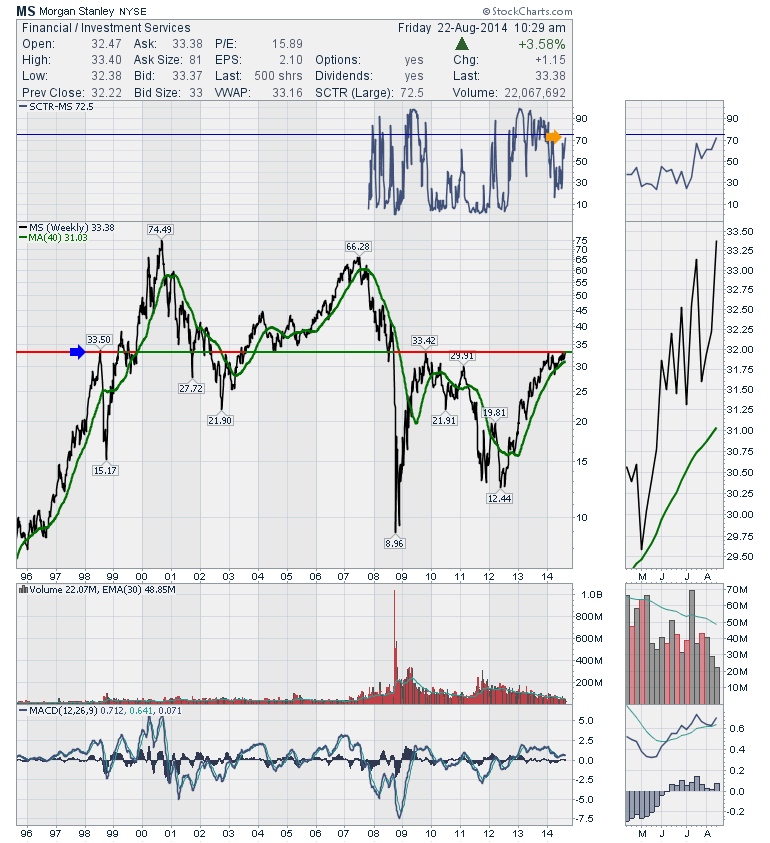
The SCTR is just about to move above 75, the MACD has cycled lower and tried to reset near zero. In the Zoom window we can see it is on an up signal.
If Morgan Stanley can finally break through and hold, it would be a very significant move on what has been a difficult ceiling for the stock.
Good trading,
Greg Schnell, CMT


