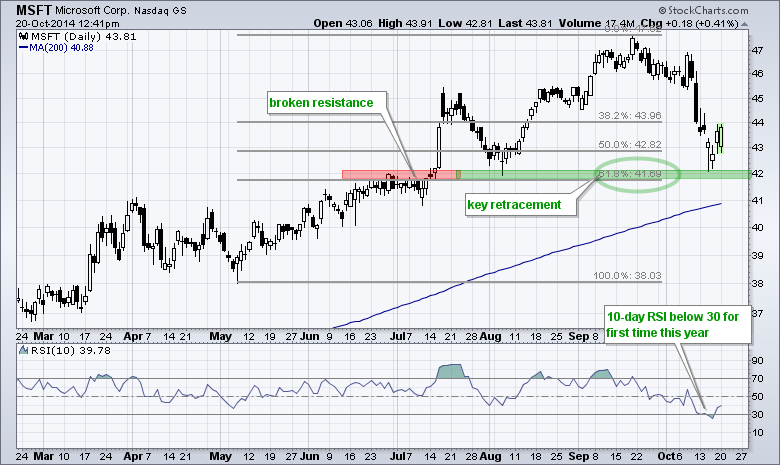
The chart below shows Microsoft (MSFT) falling to broken resistance, firming for two days and bouncing over the last two days. Also notice that this bounce occurred at the 62% retracement. Even though the decline looks steep, support held where it should and the stock is above the rising 200-day moving average (long-term uptrend). The indicator window shows 10-period RSI becoming oversold for the first time this year and moving above 30 on Friday.
Click this image for a live chart.

About the author:
Arthur Hill, CMT, is the Chief Technical Strategist at TrendInvestorPro.com. Focusing predominantly on US equities and ETFs, his systematic approach of identifying trend, finding signals within the trend, and setting key price levels has made him an esteemed market technician. Arthur has written articles for numerous financial publications including Barrons and Stocks & Commodities Magazine. In addition to his Chartered Market Technician (CMT) designation, he holds an MBA from the Cass Business School at City University in London.
Learn More