The Homebuilders ETF (XHB) is usually considered a broad indicator of the housing market. The housing market is usually associated with being an indicator of overall economic strength in the USA. We can see all of the major pullbacks in the $SPX have also shown up on the XHB. The XHB was a new ETF in 2006. It immediately started a downward slide leading into the the sub prime fallout in the USA and the global financial crisis. This was a significant precursor to the overall pullback the market ($SPX) suffered later in 2007. In 2010 and 2011, the top of the XHB coincided with the top in the $SPX. Now this chart has been making lower highs and lower lows since the Market run up into the February 2014 high. More importantly, it failed to get above the 40 WMA on the last rally.
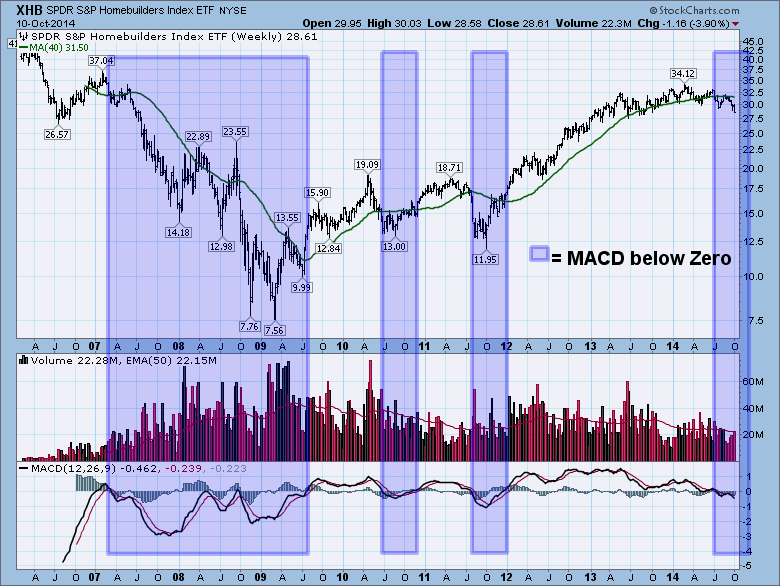
Investors in this space should be aware of the trend of lower highs and lower lows. This is the primary condition for a down trend. We are also making 52 week lows for the first time this week.
Good trading,
Greg Schnell, CMT
