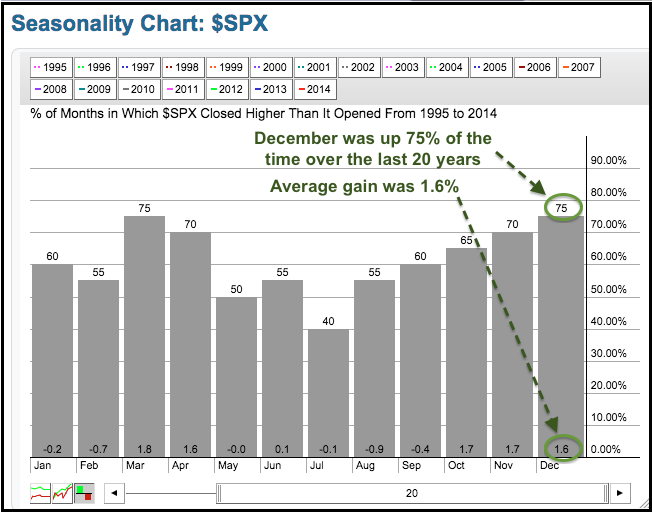
There has been a lot of chatter about the seasonal pattern for the S&P 500 in December, and it is bullish. StockCharts users do not need to rely on the chatter because they can chart seasonal patterns using our Seasonality Tool and see for themselves. The chart below shows the seasonal tendencies for the S&P 500 over the last twenty years. The S&P 500 has closed higher 75% of the time in March and December, and the average gain for December is 1.6%. Seasonal tendencies do not always pan out, but the S&P 500 is in a clear uptrend and the bullish seasonal pattern acts as another tailwind.
Click this image for a live chart.

About the author:
Arthur Hill, CMT, is the Chief Technical Strategist at TrendInvestorPro.com. Focusing predominantly on US equities and ETFs, his systematic approach of identifying trend, finding signals within the trend, and setting key price levels has made him an esteemed market technician. Arthur has written articles for numerous financial publications including Barrons and Stocks & Commodities Magazine. In addition to his Chartered Market Technician (CMT) designation, he holds an MBA from the Cass Business School at City University in London.
Learn More


